
Fig. 1
- ID
- ZDB-FIG-230131-12
- Publication
- Ortas et al., 2023 - Label-free imaging of red blood cells and oxygenation with color third-order sum-frequency generation microscopy
- Other Figures
- All Figure Page
- Back to All Figure Page
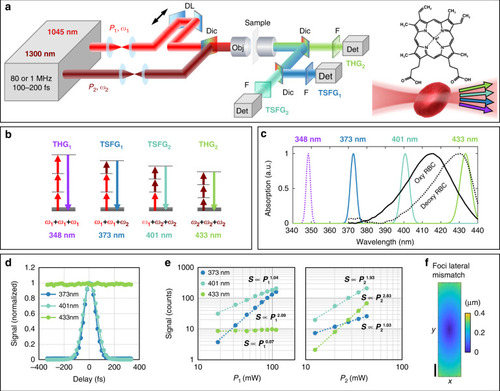
Principles of color TSFG microscopy for blood imaging.
a Experimental setup. DL: motorized optical delay line. Dic: dichroic mirror. Obj: objective lens. F: spectral bandpass filter. Det: detector. b Energy diagram of the simultaneous signals processes in color TSFG microscopy, based on third-order combinations of two excitation beams at frequencies ω1 and ω2. The wavelengths indicated are those produced in the case of mixed 1045 and 1300 nm excitation. c Measured linear absorption spectra of zebrafish RBCs in deoxygenated (dotted line) and oxygenated (solid line) states. The wavelengths generated simultaneously by color TSFG encompass the Soret absorption band of hemoglobin, enabling spectroscopic measurements. d Measured TSFG1, TSFG2 and THG2 signals from a water-glass horizontal interface as a function of the temporal delay between the two excitation pulse trains. e Measured TSFG1, TSFG2 and THG2 signals from polystyrene beads as a function of the excitation power of the pump beam (P1) and OPO beam (P2), consistent with Eq. 1. f Excitation beam foci lateral mismatch along the y-direction, reaching a maximum of 0.4 μm separation 400 µm away from the optical center. Scale bar: 100 μm. The measurement is based on data from 424 fluorescent beads distributed across the field of view |