
|
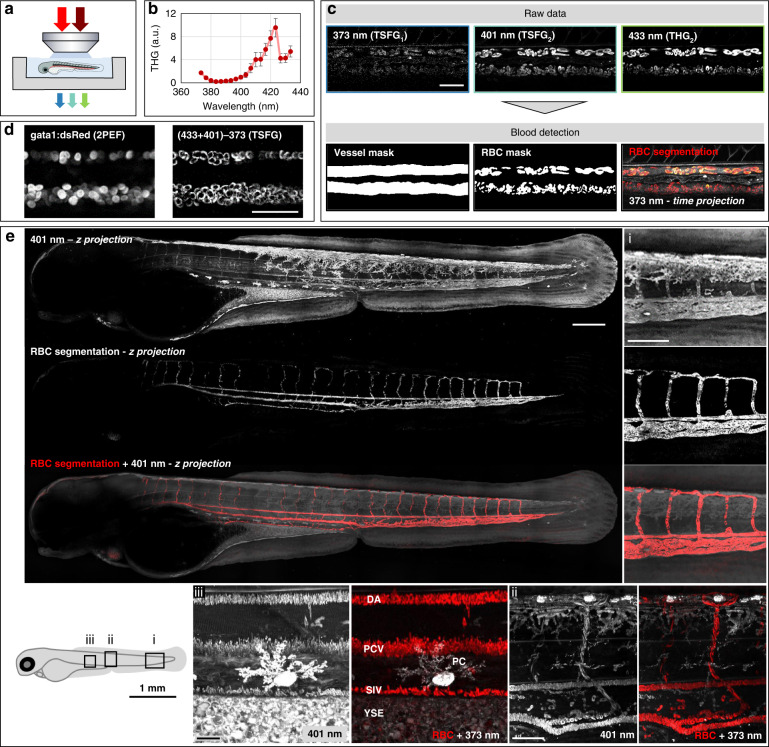
Fig. 3
a Experimental scheme. b Average single-beam THG spectrum measured from flowing RBCs in live embryos (N = 3 embryos). c Segmentation of vessels and RBCs from color TSFG images acquired simultaneously at 373, 401 and 433 nm in a region encompassing DA and PCV in 2 dpf embryos. Scale bar: 50 μm. d Simultaneously acquired TSFG and fluorescence images of RBCs in a 2 dpf Tg(gata1a:DsRed) embryo. In this experiment, we induced transient cardioplegia using MS222 to immobilize the RBCs. Scale bar: 50 μm. e TSFG image of an entire embryo recorded in a tile-like fashion over a thickness of 100 µm. Shown are a z-projection of the 401 nm channel revealing blood vessels and other structures, the automated segmentation of the vascular system (see text and methods), and the overlay with the blood shown in red. (i), (ii) and (iii) show zoomed-in details of the tail and trunk, illustrating the effective discrimination provided by color TSFG signals between red blood cells and other structures producing strong signals such as pigmented cells, lipidic structures and other interfaces. DA dorsal aorta, PCV posterior cardinal vein, SIV subintestinal vein, PC pigment cell, YSE yolk sac extension. See also Movies M3–6, and supplementary Figs. S7–S8