
- Title
-
Dynamic network biomarker identifies cdkn1a-mediated bone mineralization in the triggering phase of osteoporosis
- Authors
- Guo, W., Jin, P., Li, R., Huang, L., Liu, Z., Li, H., Zhou, T., Fang, B., Xia, L.
- Source
- Full text @ Exp. Mol. Med.

Zebrafish larva glucocorticoid-induced osteoporosis model.
a The flowchart demonstrates the process of establishing a zebrafish osteoporosis model. Zebrafish larvae (n = 20) were exposed to 10 µM dexamethasone (DEX) from D3 to D7. b Fluorescence images in each of the osteoporotic zebrafish labeled with sp7 from D3 to D7 after the addition of DEX. Scale bars: 1 mm. c Alizarin red staining images in each of the osteoporotic zebrafish from D3 to D7 after the addition of DEX. Scale bars: 1 mm. d, e Semiquantitative analysis of the mineralized area and integrated optical density (IOD) at 7 days post-fertilization (dpf). f Gene set enrichment analysis (GSEA) of the osteoblastic (upper panel)/osteoclastic (bottom panel) differentiation signature was performed from the transcriptomes of the DEX-treated zebrafish obtained from D3 and D7. g The gene set variation analysis (GSVA) algorithm estimates the variation in osteoblastic/osteoclastic differentiation pathway activity over that of the DEX-treated zebrafish obtained from D3 to D7. **P < 0.01, Student’s t-test. |
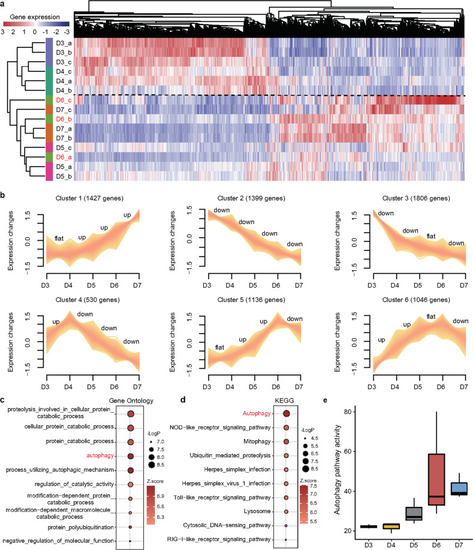
Dynamic changes in gene expression during the progression of osteoporosis.
a The heatmap shows unsupervised hierarchical clustering analysis based on differentially expressed genes (DEGs) among the five groups. The zebrafish on D6 after the addition of DEX were not concentrated but scattered, suggesting that the zebrafish were in a special and different state from other time points. b The series of graphs show the dynamic changed patterns in DEGs from D3 to D7 by Mfuzz. c, d Functional enrichment of the DEGs was summarized using (c) annotated Gene Ontology (GO) terms and (d) Kyoto Encyclopedia of Genes and Genomes (KEGG) pathways. e Quantitative assessment of the activity of autophagy in the DEX-induced osteoporosis zebrafish. |

Identifying the triggering phase of osteoporosis by the DNB algorithm.
a A schematic graph shows a phase transition during osteoporosis (upper panel). Osteoporosis progression can be divided into three stages: nonosteoporosis, preosteoporosis, and osteoporosis. Since the preosteoporosis stage is technically part of the nonosteoporosis stage, traditional biomarkers can show significant differences between the nonosteoporosis and osteoporosis stages due to their static characteristics, but they cannot be used to distinguish between the nonosteoporosis and preosteoporosis stages. Specifically, in the transition from nonosteoporosis to osteoporosis, DNB members showed an enhanced interaction with each other near the triggering phase, whereas they showed decreased interaction after the critical point (bottom panel). The diagram shows that the critical transition for osteoporosis arises at D6 after the addition of DEX, according to standard deviations, (b) Pearson correlation coefficients (PCCin and PCCout) and (c) the criticality index over all time points in gene expression profiling. d Ten representative osteoporosis-associated genes reported in previous studies were selected from the DNB members and visualized. |

The cdkn1a gene is a core DNB member.
a The diagram illustrates the DNB ranking during the critical transition of osteoporosis based on network degrees and pathway hits. b, c Volcano plot of differentially expressed genes between primary osteoporosis patients and middle-aged/elderly healthy donors. d The relative expression level of representative osteoporosis-associated genes was validated by quantitative real-time polymerase chain reaction (qRT‒PCR) in the wild-type (WT) and DEX-treated zebrafish (n = 20). e Diagram of the cdkn1a-targeting gRNA sequences. CGG, GGG, TGG and CCC (green) are the protospacer adjacent motif (PAM) sequences. Arrows indicate primer positions. f In cdkn1a crispant zebrafish, representative Sanger sequencing results of the PCR amplicons from 14 individual embryos showed different out-of-frame and in-frame indel mutations induced by Cas9/sgRNA in the targeted sites. Substitutions are represented in purple, deletions are indicated by purple strikethroughs, and insertions are highlighted in green. g, h The relative expression levels of cdkn1a were validated by qRT‒PCR in the WT, cdkn1aCas9/sgRNA, and cdkn1amRNA-treated larvae (n = 20). *P < 0.05, **P < 0.01, ****P < 0.0001, Student’s t-test. |
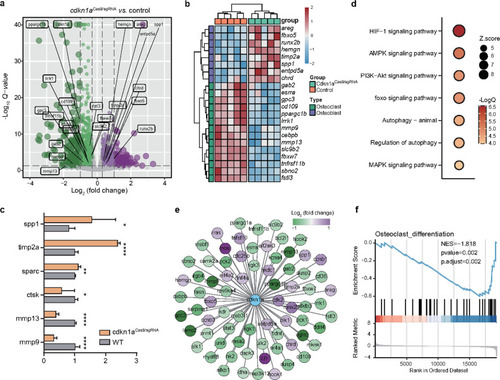
A molecular network required for osteoclast differentiation is modulated by cdkn1a.
a Differentially expressed genes (|log2Fold change | > 0.3 and FDR < 0.05 were used as thresholds) after cdkn1a knockout (n = 2437 DEGs). b Heatmap of the osteoblast- and osteoclast-associated genes between the cdkn1aCase9/sgRNA and control groups. c The expression changes of representative DEGs after cdkn1a knockout were validated by qRT‒PCR. d Functional enrichment analysis showing significant KEGG pathways among cdkn1a-regulated genes. e Global view of the cdkn1a-mediated molecular network required for osteoporosis. f GSEA showed that osteoclast differentiation was negatively enriched using cdkn1a-regulated genes. |
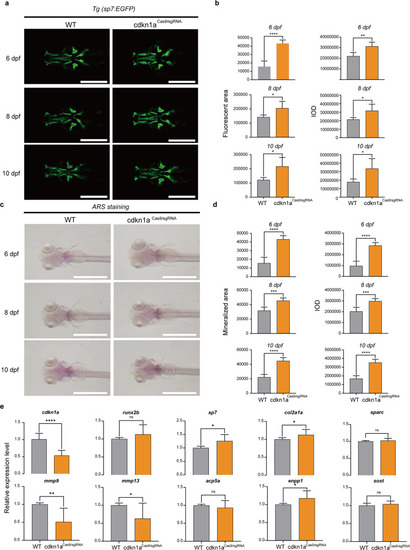
cdkn1a crispant zebrafish larvae show increased bone mineralization.
a Green fluorescent protein (GFP) images of WT and cdkn1aCas9/sgRNA-treated zebrafish head regions at 6, 8, and 10 dpf. Scale bars: 500 μm. b Semiquantitative analysis of GFP area and IOD (n = 6). c Alizarin red staining evaluated the effect of cdkn1aCas9/sgRNA treatment on bone mineralization at 6, 8, and 10 dpf compared to that in the WT group. Scale bars: 1 mm. d Semiquantitative analysis of Alizarin red staining activity (n = 6). e mRNA expression levels of genes related to osteoblasts (runx2b, sp7, col2a1a, sparc) and osteoclasts (mmp9, mmp13, acp5a, enpp1, sost) in the WT and cdkn1aCas9/sgRNA-treated groups (n = 20). *P < 0.05, **P < 0.01, ***P < 0.001, ****P < 0.0001, Student’s t-test. |
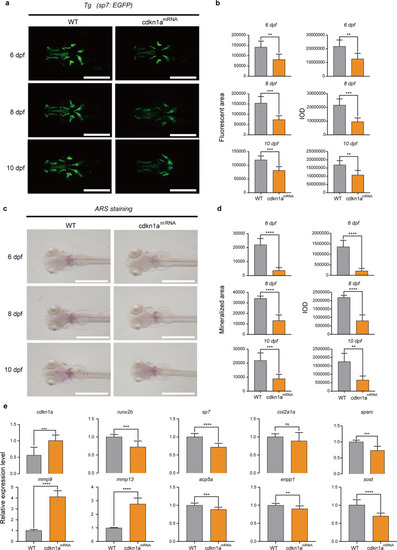
cdkn1amRNA-treated zebrafish larvae showed decreased bone mineralization.
a GFP images of WT and cdkn1amRNA-treated zebrafish head regions at 6, 8, and 10 dpf. Scale bars: 500 μm. b Semiquantitative analysis of GFP area and IOD (n = 6). c Alizarin red staining evaluated the effect of cdkn1amRNA treatment on bone mineralization at 6, 8, and 10 dpf compared to that of the WT group. Scale bars: 1 mm. d Semiquantitative analysis of Alizarin red staining activity (n = 6). e mRNA expression levels of genes related to osteoblasts (runx2b, sp7, col2a1a, sparc) and osteoclasts (mmp9, mmp13, acp5a, enpp1, sost) in the WT and cdkn1amRNA-treated groups (n = 20). *P < 0.05, **P < 0.01, ***P < 0.001, ****P < 0.0001, Student’s t-test. |

The cdkn1a mutant rescued the osteogenesis of zebrafish larvae.
a GFP images of WT, DEX-treated and DEX-treated cdkn1aCas9/sgRNA zebrafish head regions at 6, 8, and 10 dpf. Scale bars: 1 mm. b Semiquantitative analysis of GFP area and IOD (n = 6). c Alizarin red staining was used to evaluate the bone mineralization in the WT, DEX-treated, and DEX-treated cdkn1aCas9/sgRNA groups at 6, 8, and 10 dpf. Scale bar: 1 mm. d Semiquantitative analysis of Alizarin red staining activity (n = 6). e The mRNA expression levels of genes related to osteoblasts (runx2b, sp7, col2a1a, sparc) and osteoclasts (mmp9, mmp13, acp5a, enpp1, sost) in the WT, DEX-treated, and DEX-treated cdkn1aCas9/sgRNA groups (n = 20). *P < 0.05, **P < 0.01, ***P < 0.001, ****P < 0.0001, one-way ANOVA. |