
Fig. 3
- ID
- ZDB-IMAGE-230217-191
- Publication
- Guo et al., 2023 - Dynamic network biomarker identifies cdkn1a-mediated bone mineralization in the triggering phase of osteoporosis
- All Figures
- Figures for Guo et al., 2023
|
Fig. 3
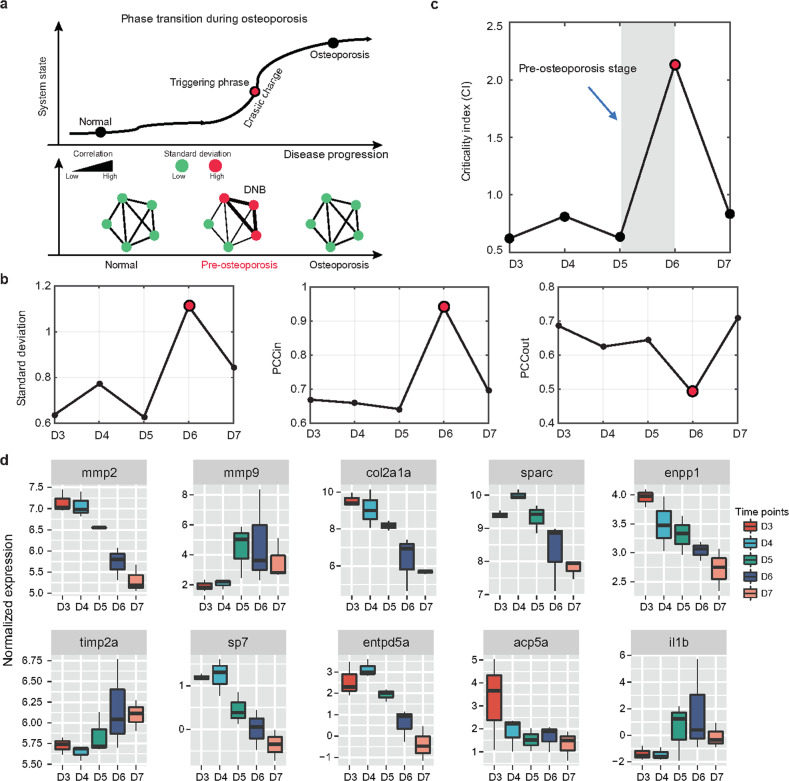
a A schematic graph shows a phase transition during osteoporosis (upper panel). Osteoporosis progression can be divided into three stages: nonosteoporosis, preosteoporosis, and osteoporosis. Since the preosteoporosis stage is technically part of the nonosteoporosis stage, traditional biomarkers can show significant differences between the nonosteoporosis and osteoporosis stages due to their static characteristics, but they cannot be used to distinguish between the nonosteoporosis and preosteoporosis stages. Specifically, in the transition from nonosteoporosis to osteoporosis, DNB members showed an enhanced interaction with each other near the triggering phase, whereas they showed decreased interaction after the critical point (bottom panel). The diagram shows that the critical transition for osteoporosis arises at D6 after the addition of DEX, according to standard deviations, (b) Pearson correlation coefficients (PCCin and PCCout) and (c) the criticality index over all time points in gene expression profiling. d Ten representative osteoporosis-associated genes reported in previous studies were selected from the DNB members and visualized.