
Fig. 7
- ID
- ZDB-IMAGE-230217-195
- Publication
- Guo et al., 2023 - Dynamic network biomarker identifies cdkn1a-mediated bone mineralization in the triggering phase of osteoporosis
- All Figures
- Figures for Guo et al., 2023
|
Fig. 7
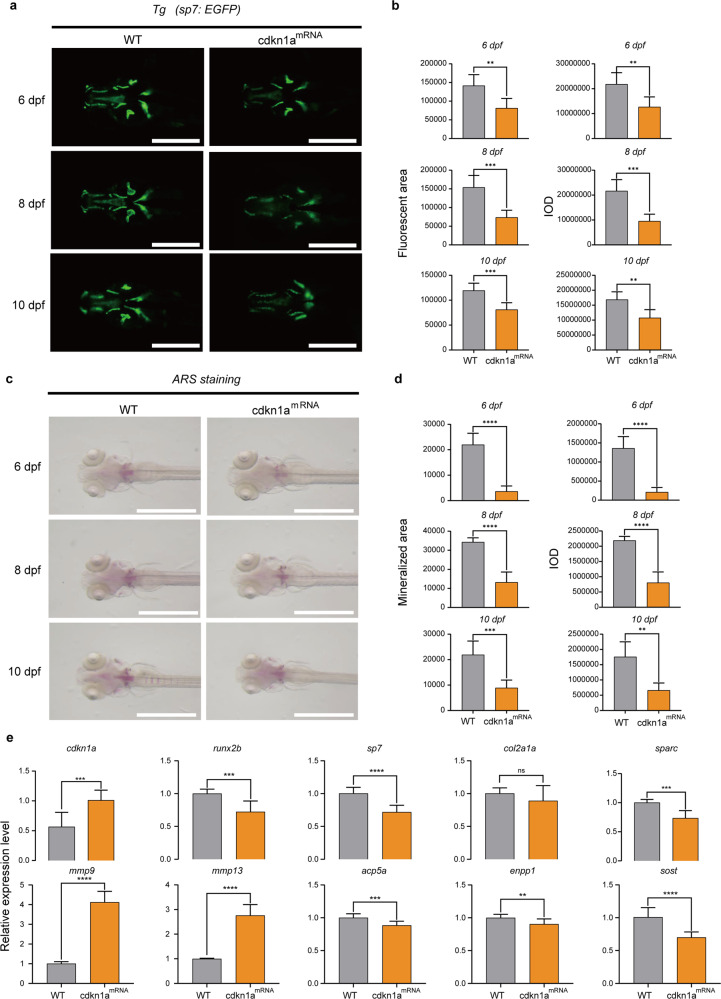
a GFP images of WT and cdkn1amRNA-treated zebrafish head regions at 6, 8, and 10 dpf. Scale bars: 500 μm. b Semiquantitative analysis of GFP area and IOD (n = 6). c Alizarin red staining evaluated the effect of cdkn1amRNA treatment on bone mineralization at 6, 8, and 10 dpf compared to that of the WT group. Scale bars: 1 mm. d Semiquantitative analysis of Alizarin red staining activity (n = 6). e mRNA expression levels of genes related to osteoblasts (runx2b, sp7, col2a1a, sparc) and osteoclasts (mmp9, mmp13, acp5a, enpp1, sost) in the WT and cdkn1amRNA-treated groups (n = 20). *P < 0.05, **P < 0.01, ***P < 0.001, ****P < 0.0001, Student’s t-test.