
- Title
-
Fluorescence intensity and lifetime imaging of lipofuscin-like autofluorescence for label-free predicting clinical drug response in cancer
- Authors
- Yan, Y., Xing, F., Cao, J., Hu, Y., Li, L., Gao, Z., Jia, H., Miao, K., Shao, F., Deng, C.X., Luo, K.Q., Lee, L.T.O., Liu, T.M.
- Source
- Full text @ Redox Biol.
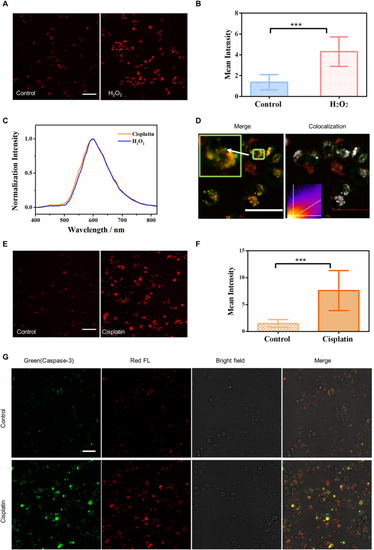
Signatures of lipofuscin red fluorescence in cell apoptosis. A- B Two-photon fluorescence imaging and intracellular fluorescence intensities (n = 30) of control and H2O2 treated (300 μM, 24 h) MDA-MB-231 cells. λex = 1060 nm; λdetect = 604–679 nm; Scale bar: 50 μm. C Two-photon fluorescence spectra (λex = 1060 nm) of red autofluorescence in cisplatin-treated (30 μM, 72 h) and H2O2 treated (300 μM, 24 h) MDA-MB-231 cells. D The colocalization of lysosomes with accumulated red autofluorophores induced by 30 μM cisplatin for 72 h. Green color: LysoTracker, excited at 488 nm. Red color: lipofuscin, excited at 561 nm. White pixels represent the colocalized ones. Scale bar: 50 μm. E-F Two-photon fluorescence imaging and intracellular fluorescence intensities (n = 30) of control and cisplatin-treated (30 μM, 72 h) MDA-MB-231 cells. λex = 1060 nm; λdetect = 604–679 nm; Scale bar: 50 μm. The statistical mean and standard deviation (error bars) in B and F were calculated from data in three independent images acquired under the same excitation conditions. ***p < 0.001, student's t-test is used when the treated group was compared with the control group. G Confocal fluorescence, bright-field, and merged images of cells stained with Caspase 3-Green in the control and cisplatin-treated groups. Green represents the distribution of caspase-3, and red represents lipofuscin fluorescence. Scale bar: 50 μm. |

Dynamic features of lipofuscin red fluorescence in apoptotic cells. A Time- and dose-dependent red autofluorescence images of 30 μM cisplatin-treated MDA-MB-231 cells. Scale bar: 100 μm. B Mean intensities of red autofluorescence in cells after different incubation times (n = 30). C Lifetime traces of cellular red autofluorescence before treatment (0 h) and at the 24th, 48th, and 72 nd h post-treatment. Data are representative of three independent experiments. |
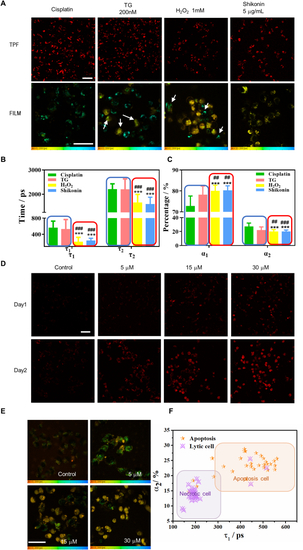
Lifetime parameters of stress-induced lipofuscin autofluorescence differentiate between necrosis and apoptosis in individual cells. A Intensity (TPF) and lifetime imaging (FILM) of two-photon red autofluorescence after treatment with 30 μM cisplatin for 72 h, 200 nM TG for 48 h, and 1 mM H2O2 and 5 μg/mL shikonin for 6 h. The TPF and FILM images were acquired from the same samples in each group. White arrows indicate necrotic cells (uniform yellow color) in TG-treated group and apoptosis cells (granules with cyan color) in H2O2-treated group. Scale bars: 50 μm. B, C Comparing the lifetime parameters τ1, τ2, α1, and α2 of individual cells (n ≥ 30) treated with different inducers. ***p < 0.001, student's t-test when H2O2 and shikonin were compared with cisplatin, ###p < 0.001, student's t-test when H2O2 and shikonin were compared with TG. The blue and red frames in (B) and (C) classified the apoptosis inducers and necrosis inducers, respectively. D OVCA429 cells were treated with 5 μM, 15 μM, and 30 μM cisplatin for one and two days. E FLIM of OVCA429 cells at each dosage. Color legend: 0–2000 ps.F The τ1-α2 scatter plot of OVCA429 cells shows that the data points for the 5 μM dosage (orange star) largely fall within the apoptosis zone, while those for the 30 μM dosage (purple triangle with a cross) largely fall within the necrosis zone. The coordinates of each dot represent the (τ1, α2) values of the individual cell (n ≥ 30). Scale bar: 50 μm. |

Lipofuscin autofluorescence enables label-free detecting treatment responses in 3D spheroids and organoids. A Two-photon fluorescence image of lipofuscin red autofluorescence in 3D spheroids before and after treatment with cisplatin (5, 15, and 30 μM) for 2 days. The insets show the 3D view in spheroids. B Average TPF intensities of cells in the control group and treated group. Data are the mean ± SD of three independent experiments. C Lifetime traces of lipofuscin red fluorescence in the 30 μM cisplatin-treated and control cells. D Two-photon fluorescence images of lipofuscin red autofluorescence in organoids before and after treatment with cisplatin (1, 5, and 30 μM) for 4 days. The insets show the 3D view in organoids. E Average TPF intensities of cells (n = 30) in the control group and treated group. Data are the mean ± SD of three independent experiments. F Lifetime traces of lipofuscin red fluorescence of the 30 μM cisplatin-treated and control groups after 4 days treatment. |
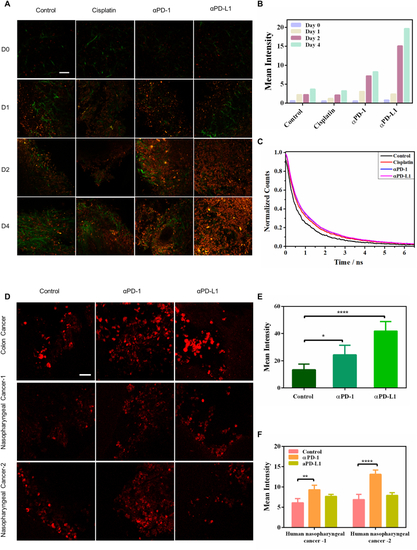
Lipofuscin autofluorescence reports the responses of immune-checkpoint-blockade (ICB) therapy in mice and human 3D tumor slices (TSC). A Two-photon fluorescence microscopy (λex = 1060 nm) of drug-induced lipofuscin fluorescence (red color) and second harmonic generation imaging of collagen networks (green color) in 3D-TSCs. Scale bar: 50 μm. B Average TPF intensities of lipofuscin fluorescence in 3D-TSCs treated with cisplatin, αPD-1, and αPD-L1 for four days. Lifetime traces of lipofuscin fluorescence in the control group, chemotherapy (cisplatin) group, and ICB therapy groups (αPD-1 and αPD-L1). C Lifetime traces of lipofuscin red fluorescence of the treated and control groups at the 4th-day post-treatment. D Two-photon fluorescence microscopy (λex = 1060 nm) of ICB therapy-induced lipofuscin fluorescence (red color) in the 3D-TSC of human colon cancers (10 μg/mL αPD-1 and αPD-L1 for 7 days) and nasopharyngeal cancers (10 μg/mL αPD-1 and αPD-L1 for 3 days). Scale bar: 50 μm. E, F Average TPF intensities of lipofuscin fluorescence in 3D-TSCs treated with αPD-1 and αPD-L1. ***p < 0.001, student's t-test when αPD-1/αPD-L1 compared with control. |
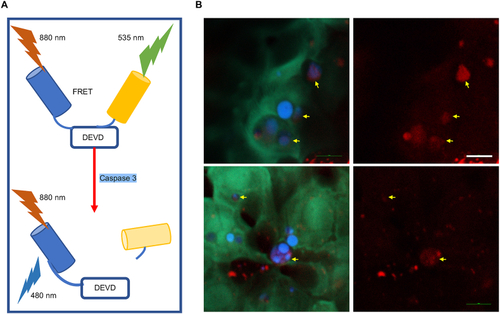
Non-invasive and label-free monitoring of the apoptotic cells during the natural skin development in the yolk sac region of the zebrafish. A Principle of C3-sensor probing apoptosis in zebrafish. B CFP-YFP FRET imaging was used to probe the apoptotic cell during the natural skin development in the yolk sac region of the zebrafish. The DEVD-linked fusion protein (CFP/YFP) emits yellowish-green fluorescence (green color) and represents the location of live cells. The blue color indicates the CFP emmision from apoptotic ones. The yellow arrows indicate the corresponding lipofuscin fluorescence of each apoptotic cell. Scale bar: 10 μm. |