
Fig. 3
- ID
- ZDB-FIG-230616-19
- Publication
- Yan et al., 2022 - Fluorescence intensity and lifetime imaging of lipofuscin-like autofluorescence for label-free predicting clinical drug response in cancer
- Other Figures
- All Figure Page
- Back to All Figure Page
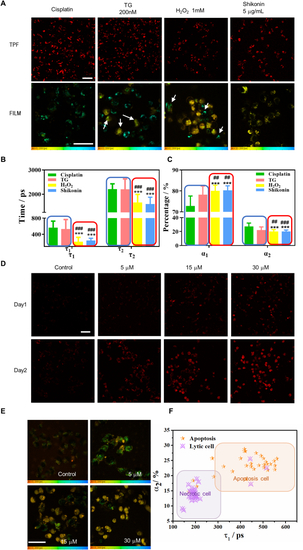
Lifetime parameters of stress-induced lipofuscin autofluorescence differentiate between necrosis and apoptosis in individual cells. A Intensity (TPF) and lifetime imaging (FILM) of two-photon red autofluorescence after treatment with 30 μM cisplatin for 72 h, 200 nM TG for 48 h, and 1 mM H2O2 and 5 μg/mL shikonin for 6 h. The TPF and FILM images were acquired from the same samples in each group. White arrows indicate necrotic cells (uniform yellow color) in TG-treated group and apoptosis cells (granules with cyan color) in H2O2-treated group. Scale bars: 50 μm. B, C Comparing the lifetime parameters τ1, τ2, α1, and α2 of individual cells (n ≥ 30) treated with different inducers. ***p < 0.001, student's t-test when H2O2 and shikonin were compared with cisplatin, ###p < 0.001, student's t-test when H2O2 and shikonin were compared with TG. The blue and red frames in (B) and (C) classified the apoptosis inducers and necrosis inducers, respectively. D OVCA429 cells were treated with 5 μM, 15 μM, and 30 μM cisplatin for one and two days. E FLIM of OVCA429 cells at each dosage. Color legend: 0–2000 ps.F The τ1-α2 scatter plot of OVCA429 cells shows that the data points for the 5 μM dosage (orange star) largely fall within the apoptosis zone, while those for the 30 μM dosage (purple triangle with a cross) largely fall within the necrosis zone. The coordinates of each dot represent the (τ1, α2) values of the individual cell (n ≥ 30). Scale bar: 50 μm. |