
|
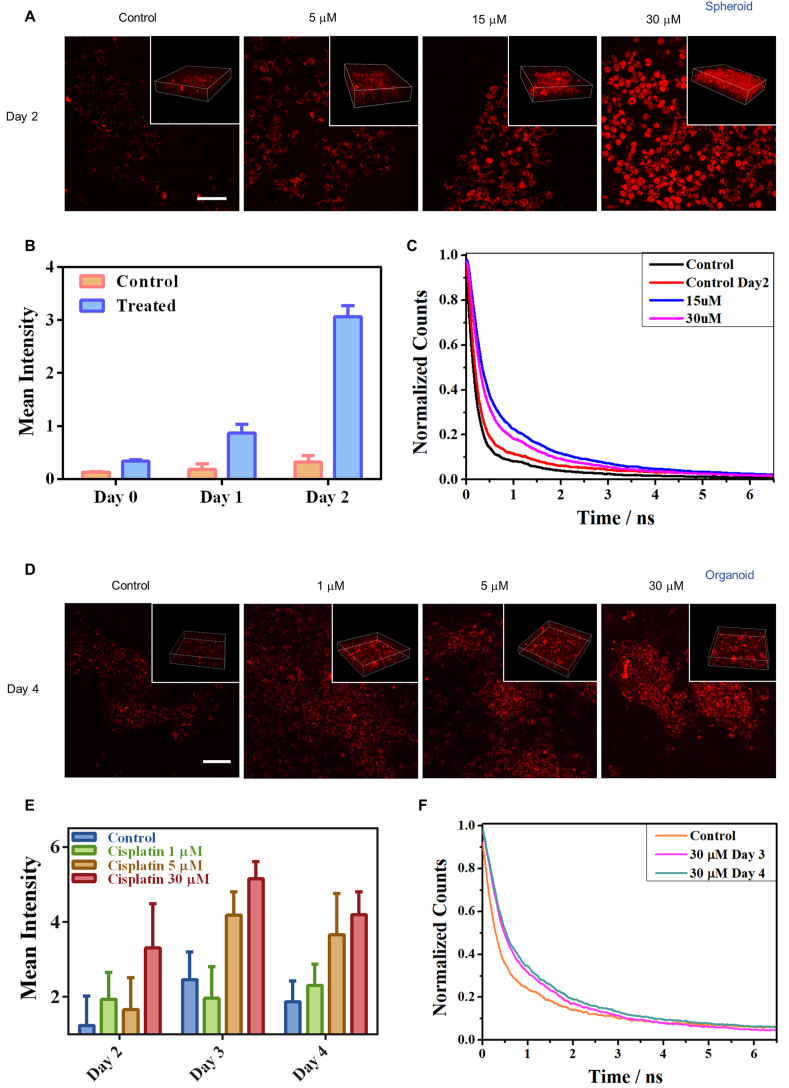
Fig. 4
Lipofuscin autofluorescence enables label-free detecting treatment responses in 3D spheroids and organoids. A Two-photon fluorescence image of lipofuscin red autofluorescence in 3D spheroids before and after treatment with cisplatin (5, 15, and 30 μM) for 2 days. The insets show the 3D view in spheroids. B Average TPF intensities of cells in the control group and treated group. Data are the mean ± SD of three independent experiments. C Lifetime traces of lipofuscin red fluorescence in the 30 μM cisplatin-treated and control cells. D Two-photon fluorescence images of lipofuscin red autofluorescence in organoids before and after treatment with cisplatin (1, 5, and 30 μM) for 4 days. The insets show the 3D view in organoids. E Average TPF intensities of cells (n = 30) in the control group and treated group. Data are the mean ± SD of three independent experiments. F Lifetime traces of lipofuscin red fluorescence of the 30 μM cisplatin-treated and control groups after 4 days treatment.