
Fig. 5
- ID
- ZDB-FIG-230616-21
- Publication
- Yan et al., 2022 - Fluorescence intensity and lifetime imaging of lipofuscin-like autofluorescence for label-free predicting clinical drug response in cancer
- Other Figures
- All Figure Page
- Back to All Figure Page
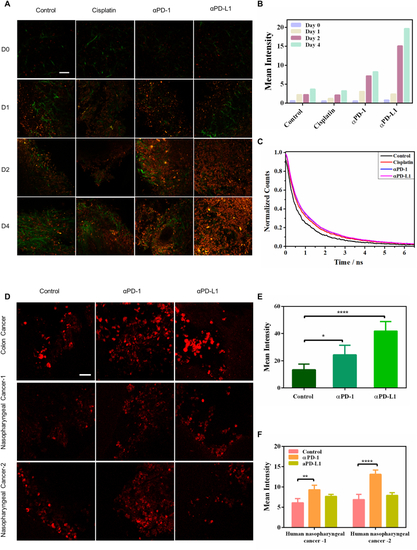
Lipofuscin autofluorescence reports the responses of immune-checkpoint-blockade (ICB) therapy in mice and human 3D tumor slices (TSC). A Two-photon fluorescence microscopy (λex = 1060 nm) of drug-induced lipofuscin fluorescence (red color) and second harmonic generation imaging of collagen networks (green color) in 3D-TSCs. Scale bar: 50 μm. B Average TPF intensities of lipofuscin fluorescence in 3D-TSCs treated with cisplatin, αPD-1, and αPD-L1 for four days. Lifetime traces of lipofuscin fluorescence in the control group, chemotherapy (cisplatin) group, and ICB therapy groups (αPD-1 and αPD-L1). C Lifetime traces of lipofuscin red fluorescence of the treated and control groups at the 4th-day post-treatment. D Two-photon fluorescence microscopy (λex = 1060 nm) of ICB therapy-induced lipofuscin fluorescence (red color) in the 3D-TSC of human colon cancers (10 μg/mL αPD-1 and αPD-L1 for 7 days) and nasopharyngeal cancers (10 μg/mL αPD-1 and αPD-L1 for 3 days). Scale bar: 50 μm. E, F Average TPF intensities of lipofuscin fluorescence in 3D-TSCs treated with αPD-1 and αPD-L1. ***p < 0.001, student's t-test when αPD-1/αPD-L1 compared with control. |