
Fig. 1
- ID
- ZDB-FIG-230616-17
- Publication
- Yan et al., 2022 - Fluorescence intensity and lifetime imaging of lipofuscin-like autofluorescence for label-free predicting clinical drug response in cancer
- Other Figures
- All Figure Page
- Back to All Figure Page
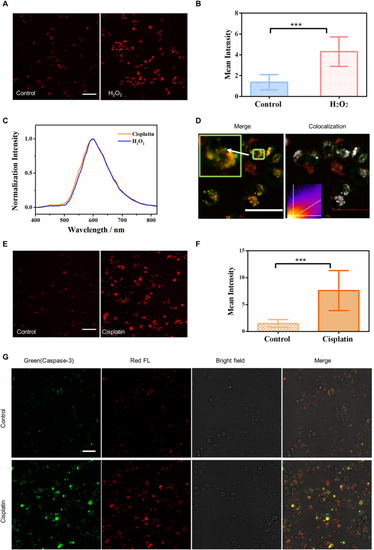
Signatures of lipofuscin red fluorescence in cell apoptosis. A- B Two-photon fluorescence imaging and intracellular fluorescence intensities (n = 30) of control and H2O2 treated (300 μM, 24 h) MDA-MB-231 cells. λex = 1060 nm; λdetect = 604–679 nm; Scale bar: 50 μm. C Two-photon fluorescence spectra (λex = 1060 nm) of red autofluorescence in cisplatin-treated (30 μM, 72 h) and H2O2 treated (300 μM, 24 h) MDA-MB-231 cells. D The colocalization of lysosomes with accumulated red autofluorophores induced by 30 μM cisplatin for 72 h. Green color: LysoTracker, excited at 488 nm. Red color: lipofuscin, excited at 561 nm. White pixels represent the colocalized ones. Scale bar: 50 μm. E-F Two-photon fluorescence imaging and intracellular fluorescence intensities (n = 30) of control and cisplatin-treated (30 μM, 72 h) MDA-MB-231 cells. λex = 1060 nm; λdetect = 604–679 nm; Scale bar: 50 μm. The statistical mean and standard deviation (error bars) in B and F were calculated from data in three independent images acquired under the same excitation conditions. ***p < 0.001, student's t-test is used when the treated group was compared with the control group. G Confocal fluorescence, bright-field, and merged images of cells stained with Caspase 3-Green in the control and cisplatin-treated groups. Green represents the distribution of caspase-3, and red represents lipofuscin fluorescence. Scale bar: 50 μm. |