
- Title
-
Variable phenotypes and penetrance between and within different zebrafish ciliary transition zone mutants
- Authors
- Wang, J., Thomas, H.R., Thompson, R.G., Waldrep, S.C., Fogerty, J., Song, P., Li, Z., Ma, Y., Santra, P., Hoover, J.D., Yeo, N.C., Drummond, I.A., Yoder, B.K., Amack, J.D., Perkins, B., Parant, J.M.
- Source
- Full text @ Dis. Model. Mech.
|
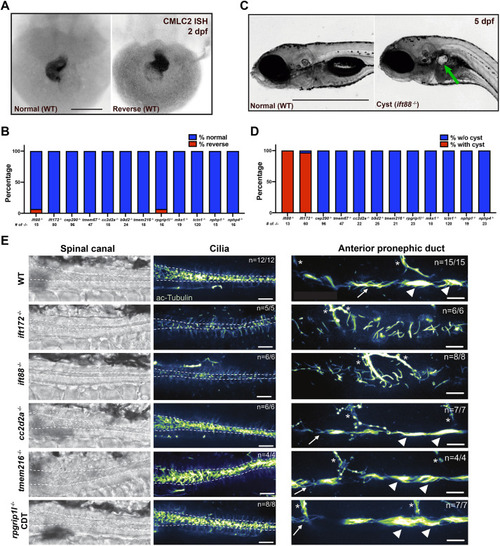
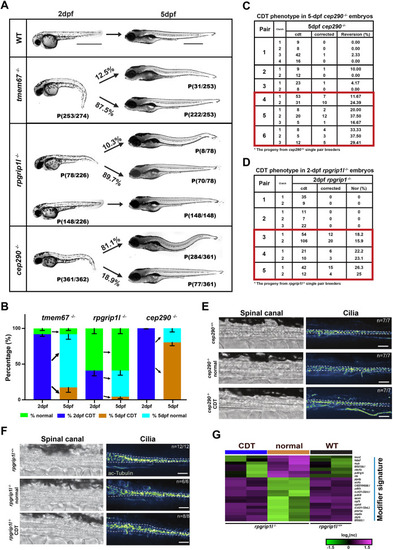
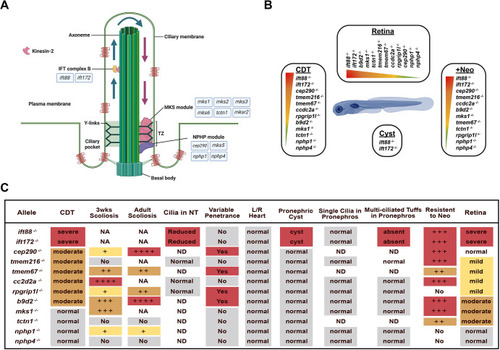
PHENOTYPE:
|
|
PHENOTYPE:
|
|
|
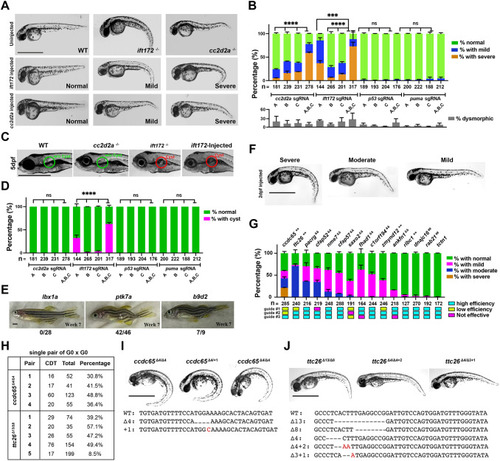
PHENOTYPE:
|
|

ZFIN is incorporating published figure images and captions as part of an ongoing project. Figures from some publications have not yet been curated, or are not available for display because of copyright restrictions. |
|
Unillustrated author statements |