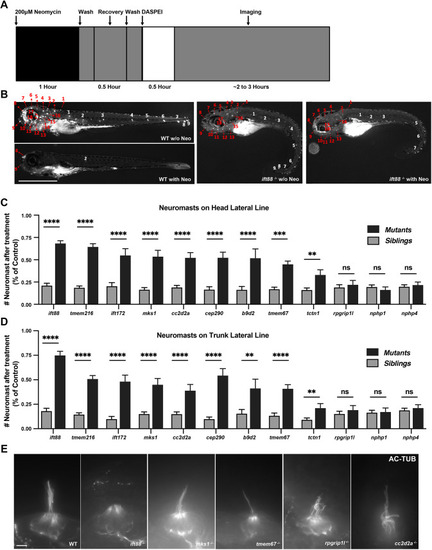
TZ mutants have variable resistance to neomycin treatment. (A) Diagram of timeline of neuromast staining. Zebrafish embryos at 5 dpf were exposed to 200 µM neomycin for 1 h, and neuromasts in the lateral line were stained with 2-[4-(dimethylamino) styryl]-N-ethylpyridinium iodide (DASPEI) and counted 2 h following initial neomycin exposure. (B) Representative images of neuromasts in the lateral line in WT and ift88−/− zebrafish embryos at 5 dpf stained with DASPEI with and without (w/o) 200 nM neomycin treatment. The positions of neuromasts are numbered; red numbers indicate neuromasts in the head, and white numbers indicate neuromasts in the trunk. Scale bar: 1000 μm. (C,D) Percentage of neuromasts after neomycin treatment in the head (C) and trunk (D) lateral line for mutants and their siblings (including WT and heterozygous). Error bars represent ±s.e.m. ns, not significant; **P<0.01, ***P<0.001 and ****P<0.0001. Unpaired two-tailed Student's t-test (n>20 for all mutants from two independent experiments). (E) Representative images of anti-acetylated Tubulin staining of mechanosensory hair cells in WT, and ift88, mks1, tmem67, rpgrip1l and cc2d2a mutant embryos at 2 dpf. Scale bar: 5 μm.
|
