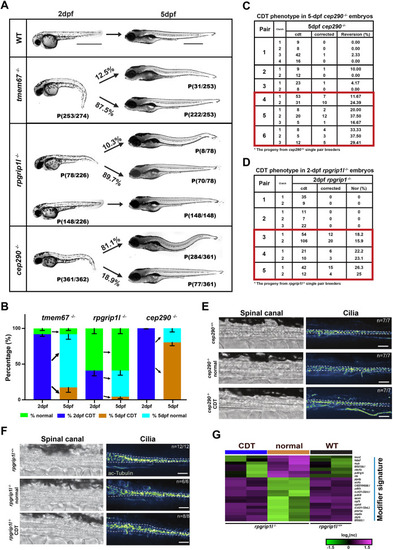
Variable penetrance of the CDT phenotype in tmem67, rpgrip1l and cep290 mutants. (A) Lateral views of WT and mutants at 2 dpf and 5 dpf. All homozygous mutant embryos were obtained from a single pair of heterozygous mutant crosses that were dechorionated at 1 dpf. Embryos were sorted for CDT at 2 dpf and then reanalyzed at 5 dpf. All embryos were genotyped after phenotype analysis at 5 dpf. Arrows denote the phenotypic changes across time. Percentage was calculated as the % of observed number of −/− at 5 dpf divided by the observed number of −/− at 2 dpf. Scale bars: 1000 μm. (B) Bar graph representing distribution of CDT phenotype at 2 dpf and 5 dpf. For tmem67−/−, n=274 from ten breeding pairs of tmem67+/− adults. For cep290−/−, n=351 from 23 breeding pairs of cep290+/− adults. For rpgrip1l−/−, n=226 from ten breeding pairs of rpgrip1l+/− adults. Arrows point to derivates of the 2 dpf phenotype. Error bars represent ±s.e.m. (C) Table depicting the revertant rate from repeatedly bred cep290+/− pairs. (D) Table depicting the ratio of embryos with normal-looking tail from repeatedly bred rpgrip1l−/− pairs. As above, embryos were dechorionated at 1 dpf, sorted at 2 dpf, reanalyzed at 5 dpf and genotyped after. Data are only for cep290−/− and rpgrip1l−/− embryos. Red boxes in C and D denote pairs that had repeatedly high reversion rates. (E) Comparison of spinal canal cilia in tails of cep290l−/− embryos with a CDT or reverted normal-looking tail at 5 dpf. Representative brightfield images of the spinal canal and fluorescent images of acetylated-Tubulin staining (green fire blue LUT) are shown for WT, cep290−/− embryos with a normal-looking tail and cep290−/− embryos with CDT. Dashed lines outline approximate boundaries of the spinal canal. Scale bars: 25 μm. (F) Comparison of spinal canal cilia in tails of rpgrip1l−/− embryos with CDT or normal-looking tail. Representative brightfield images of the spinal canal and fluorescent images of acetylated-Tubulin staining (green fire blue LUT) are shown for rpgrip1l+/+ and rpgrip1l−/− embryos with a normal-looking (straight) tail, and rpgrip1l−/− embryos with a CDT. Dashed lines outline approximate boundaries of the spinal canal. n=number of embryos with the depicted staining/total number of embryos analyzed. Scale bars: 25 μm. (G) K-means clustering of log2 normalized counts define modifier signature cluster among the top 100 DEGs in 2 dpf rpgrip1l−/− with CDT, rpgrip1l−/− with normal-looking tail (normal) and rpgrip1l+/+ groups (WT).
|
