
- Title
-
Functional role of CD40 and CD154 costimulatory signals in IgZ-mediated immunity against bacterial infection
- Authors
- Su, N., Hu, C.B., Shao, T., Jin, C.Y., Li, H., Ji, J.F., Qin, L.L., Fan, D.D., Lin, A.F., Xiang, L.X., Shao, J.Z.
- Source
- Full text @ Fish Shellfish Immunol Rep
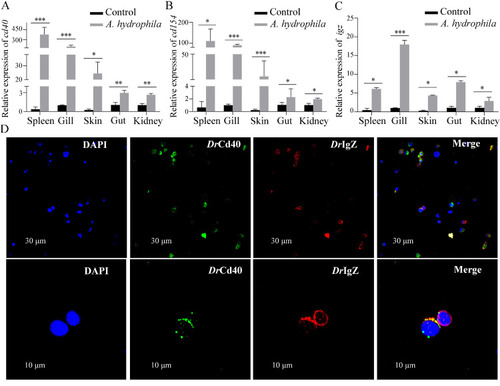
Examination on the expression of cd40/cd154 and igz genes in immune-related tissues and distribution of Cd40 on IgZ+ B cells of zebrafish. (A − C) Real-time PCR analysis for the expression of Cd40, Cd154 and igz in spleen, gill, skin, gut and head kidney tissues in A. hydrophila-stimulated groups. All data were obtained from at least three independent experiments (n = 30). ⁎p < 0.05, ⁎⁎p< 0.01, ⁎⁎⁎p < 0.001. (D) Immunofluorescence staining of Cd40 and IgZ on leucocytes. Cells were stained with rabbit anti-Cd40 (green) together with mouse anti-IgZ (red). DAPI (blue) shows the location of the nuclei. The images were obtained using a two-photon laser scanning confocal microscope (Zeiss LSM-710; original magnification, 630×). Scale bars, 30 μm or 10 μm. |
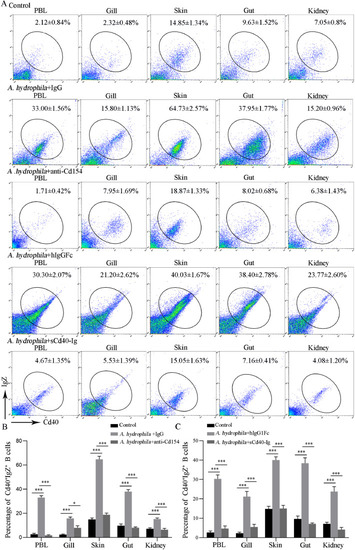
Evaluation on the functional role of Cd40/Cd154 in Cd40+IgZ+ B cell proliferation in immune-related tissues of zebrafish with or without in vivo depletion or blockade of Cd154. (A) Examination on the percentage of Cd40+IgZ+ B cells in different tissues by FCM analysis, in which the different treatments were presented at the top of each block diagram. Each diagram is a representative of the three independent experiments. (B, C) Histogram shows the statistical analysis of the percentage of Cd40+IgZ+ B cells in each tissue as examined in the FCM analysis. All data were obtained from at least three independent experiments (n = 30). ⁎p < 0.05, ⁎⁎p< 0.01, ⁎⁎⁎p < 0.001. |

Evaluation on the functional role of Cd40 and Cd154 in vaccinated immunoprotection. (A) Depletion of Cd154+ cells or blockade of Cd154 protein impaired the vaccinated immunoprotection of zebrafish against A. hydrophila (1 × 10⁵ CFU/fish) challenge. Kaplan-Meier survival curves represent data pooled from three independent experiments (n = 30). (B) Histogram shows the statistical analysis of the survival rate of fish (n = 30) in different treatment groups after infection with A. hydrophila for 50 h. All data were obtained from at least three independent experiments (n = 30). ⁎p < 0.05, ⁎⁎p< 0.01, ⁎⁎⁎p < 0.001. |
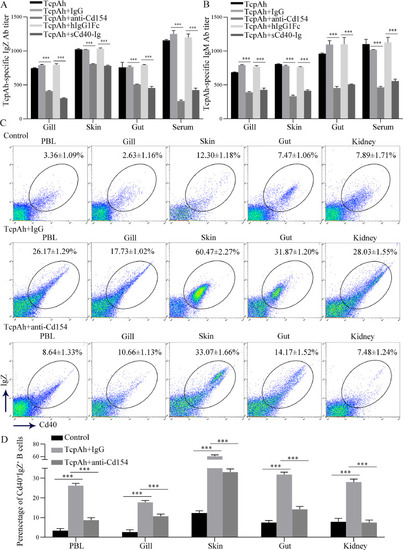
Evaluation of the functional role of Cd40 and Cd154 in TD antigen-induced IgZ immune response. (A, B) Examination of TcpAh-specific IgZ and IgM antibody titers in different tissues and serum samples of zebrafish at 7 and 21 days post-immunization by ELISA. (C) Examination on the percentage of Cd40+IgZ+ B cells in different tissues by FCM analysis, in which the different treatments were presented at the top of each block diagram. Each diagram is a representative of the three independent experiments. (D) Histogram shows the statistical analysis of the percentage of Cd40+IgZ+ B cells in each tissue as examined in the FCM analysis. All data were obtained from at least three independent experiments (n = 30). ⁎p < 0.05, ⁎⁎p< 0.01, ⁎⁎⁎p < 0.001. |

Validation of the thymus-dependency of TcpAh-induced IgZ immune response by using the CsA inhibitor. (A) FCM analysis for T cell activation by the change of Cd4+Cd154+ T cell proportion in different tissues of zebrafish via in vivo stimulation with TcpAh protein and administration with CsA (5 μg/fish). (B) Histogram shows the statistical analysis of the percentage of Cd4+Cd154+ T cells in each tissue as examined in the FCM analysis. (C, D) Examination on the reduced TcpAh-specific IgZ Ab and IgM Ab titers in different tissues and serum samples of zebrafish by in vivo administration of TcpAh plus CsA through ELISA. All data were obtained from at least three independent experiments (n = 30). ⁎p < 0.05, ⁎⁎p< 0.01, ⁎⁎⁎p < 0.001. |
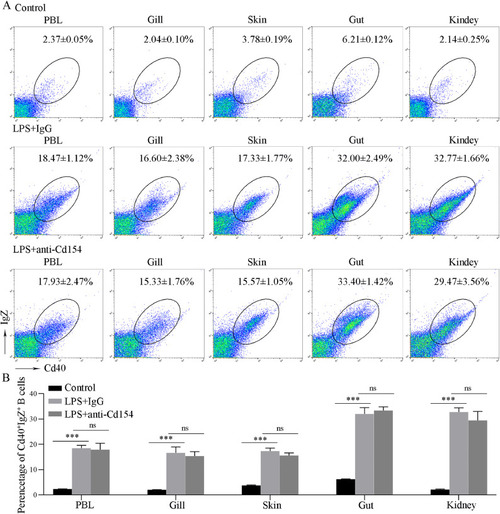
Evaluation of the functional role of Cd40 and Cd154 in TI antigen-induced IgZ immune response. (A) FCM analysis for the percentage of Cd40+IgZ+ B cells in different tissues of zebrafish by in vivo administration with LPS plus anti-Cd154 antibody. (B) Histogram shows the statistical analysis of the percentage of Cd40+IgZ+ B cells in each tissue as examined in the FCM analysis. All data were obtained from at least three independent experiments (n = 30). ⁎p < 0.05, ⁎⁎p< 0.01, ⁎⁎⁎p < 0.001. |