
|
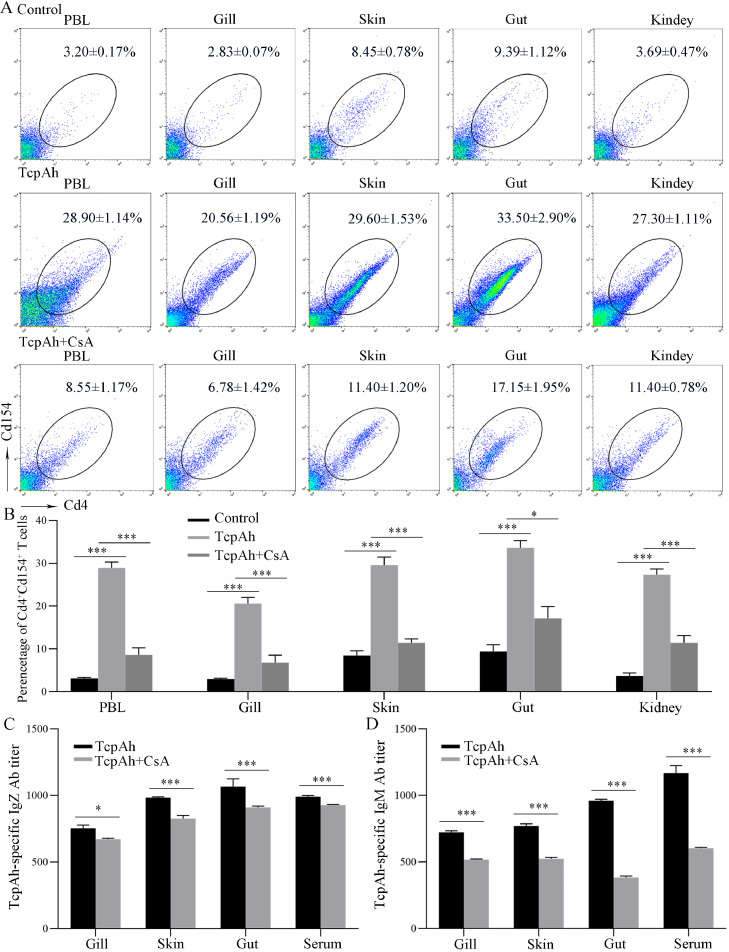
Fig. 5
Validation of the thymus-dependency of TcpAh-induced IgZ immune response by using the CsA inhibitor. (A) FCM analysis for T cell activation by the change of Cd4+Cd154+ T cell proportion in different tissues of zebrafish via in vivo stimulation with TcpAh protein and administration with CsA (5 μg/fish). (B) Histogram shows the statistical analysis of the percentage of Cd4+Cd154+ T cells in each tissue as examined in the FCM analysis. (C, D) Examination on the reduced TcpAh-specific IgZ Ab and IgM Ab titers in different tissues and serum samples of zebrafish by in vivo administration of TcpAh plus CsA through ELISA. All data were obtained from at least three independent experiments (n = 30). ⁎p < 0.05, ⁎⁎p< 0.01, ⁎⁎⁎p < 0.001.