
- Title
-
Brainstem circuits encoding start, speed, and duration of swimming in adult zebrafish
- Authors
- Berg, E.M., Mrowka, L., Bertuzzi, M., Madrid, D., Picton, L.D., El Manira, A.
- Source
- Full text @ Neuron
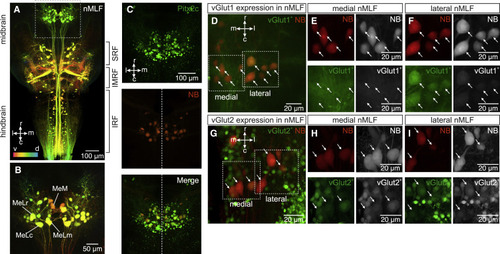
Separate molecular and anatomical nMLF neuronal populations (A) Orthogonal projection of confocal images showing reticulospinal neurons retrogradely labeled by biotinylated dextran injection in the spinal cord (IRF, inferior reticular formation; IMRF, intermediate reticular formation; SRF, superior reticular formation). Dorso-ventral position is color coded (v, ventral in red and d, dorsal in blue). (B) Enlarged image of the nMLF (dashed box in A) showing four cells individually identified across animals (MeM, MeLm, MeLr, and MeLc). (C) Top panel shows that nMLF neurons express the transcription factor Pitx2c. Middle panel shows neurobiotin (NB) retrogradely labeled nMLF neurons from the spinal cord (red). Bottom panel is the merge of Pitx2c expression and neurobiotin showing double labeled nMLF neurons. (D) Orthogonal projection of confocal images showing the differential expression of vGlut1 in nMLF neurons. (E) Lack of expression of vGlut1 in medial nMLF neurons indicated by the dashed box “medial” in (D) (arrows indicate the position of neurobiotin [NB] labeled neurons). (F) Expression of vGlut1 in lateral nMLF neurons indicated by the dashed box “lateral” in (D) (arrows indicate the position of neurobiotin [NB] labeled neurons). (G) Orthogonal projection of confocal images showing the differential expression of vGlut2 in nMLF neurons. (H) Strong expression of vGlut2 in medial nMLF neurons indicated by the dashed box “medial” in (G) (arrows indicate the position of neurobiotin [NB] labeled neurons). (I) Weak expression of vGlut2 in lateral nMLF neurons indicated by the dashed box “lateral” in (G) (arrows indicate the position of neurobiotin [NB] labeled neurons). |
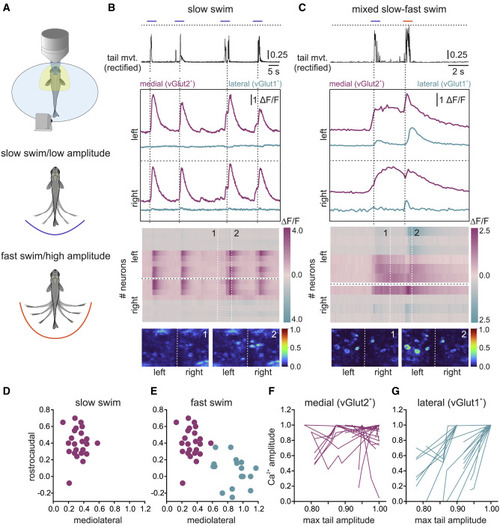
Speed-related recruitment of the two nMLF neuronal populations (A) Upper panel shows the experimental setup with head-fixed adult zebrafish in which the tail movement is monitored via a video camera, while the calcium activity of nMLF neurons is examined using a two-photon confocal microscope. The two lower panels illustrate spontaneous swimming at slow speed/low amplitude (blue) or fast speed/high amplitude (orange). (B) During slow swim episodes (tail movement trace indicated with a blue line in the upper panel) medial vGlut2+ nMLF neurons were activated bilaterally, whereas the lateral vGlut1+ neurons were not recruited (second panel). The dashed black horizontal line indicates the highest amplitude reached during fast speed/high amplitude swim in (C). Third panel shows the increase in calcium activity in medial vGlut2+ and the lack of activity in lateral vGlut1+ nMLF neurons. Last panel shows the calcium activity at two time points (1 and 2) indicated by the white dashed lines in the panel above. (C) During slow swim episodes associated with small tail movements (tail movement trace indicated with a blue line in the upper panel), only medial vGlut2+ nMLF neurons were activated bilaterally. During mixed episodes with slow and fast swim, the lateral vGlut1+ neurons were only recruited during fast swimming associated with large tail movements (indicated by the orange line in the upper panel). Third panel shows the changes in calcium levels in medial vGlut2+ and lateral vGlut1+ nMLF neurons on the left and right sides. Last panel shows the calcium activity at two time points (1 and 2) indicated by the white dashed lines in the panel above. (D) Only medial nMLF neurons were recruited during slow swim. (E) Both medial and lateral nMLF were recruited during fast swim. (F) Medial vGlut2+ nMLF neurons did not increase their activity with increased swim movement amplitude. (G) Lateral vGlut1+ nMLF neurons increased their activity with increased tail movement amplitude during swimming. |
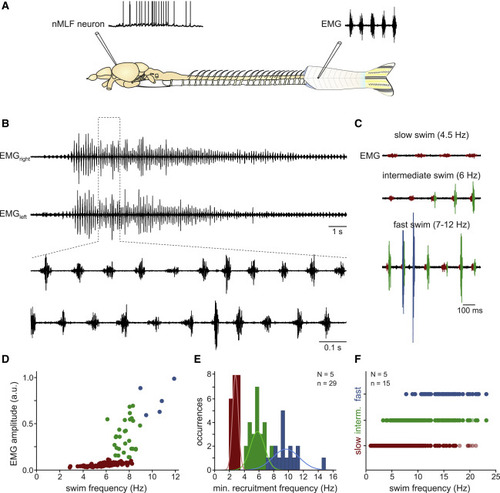
Spontaneous swim activity in the absence of sensory input in adult zebrafish (A) Experimental setup for ex vivo recordings of nMLF neurons during spontaneous swimming activity. (B) Representative example of a spontaneous swimming episode recorded as EMG activity on the right and left body sides. Enlarged portion shows coordinated swim pattern with alternating muscle activity between the right and left body sides. (C) The amplitude of the EMG activity increased with increasing swim frequency. Small slow muscle units (red) were recruited during slow swimming (top, 4.5 Hz swim frequency). Both slow (red) and intermediate (green) muscle units were recruited during intermediate swim (middle, 6 Hz swim frequency). Slow (red), intermediate (green), and large fast (blue) muscle units were all recruited during fast swimming (bottom, 7–12 Hz swim frequency). (D) Recruitment of slow (red), intermediate (green), and fast (blue) muscle units with increasing swim frequency. Each dot denotes one swim cycle pooled from several swim episodes in a single animal. (E) Minimum recruitment frequencies of the slow (red), intermediate (green), and fast (blue) units observed in 29 swim episodes in 5 fish. (F) Activity span of different muscle units (slow, red; intermediate, green; fast, blue). Each dot denotes one swim cycle during which the respective muscle units were active (data from n = 15 swim episodes in N = 5 fish). |
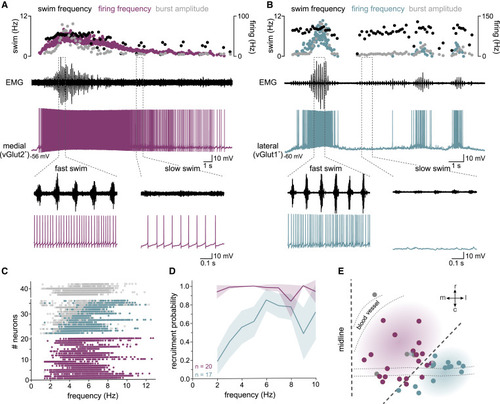
Activity of nMLF neuron subpopulations coding onset, duration, and speed of swimming (A) Recording of a medial vGlut2+ nMLF neuron (purple trace) recruited throughout a whole swim episode monitored by recording muscle activity (black trace). Upper panel: graph shows the instantaneous swim frequency (black dots, each dot denotes one swim cycle), the instantaneous neuronal firing frequency (purple dots, ISF in Hz), and the muscle burst amplitude (gray dots). Bottom panels: expanded traces indicated by dashed lines showing a difference in firing frequency of the recorded medial vGlut2+ nMLF neuron at slow versus fast swim activity. (B) Recording of a lateral vGlut1+ nMLF neuron (blue trace) recruited only during high swim speed (black trace). Upper panel: graph shows instantaneous swim frequency (black dots, each dot denotes one swim cycle), instantaneous neuronal firing frequency (blue dots, ISF in Hz), and the corresponding muscle burst amplitude (gray dots, each dot denotes one swim cycle). Bottom panel: expanded traces indicated by the dashed lines showing that the recorded lateral vGlut1+ nMLF neuron is recruited only during fast but not slow swimming. (C) Recruitment of medial vGlut2+ (purple dots) and lateral vGlut1+ (blue dots) nMLF neurons in relation to the swim frequency. Each line shows the recruitment of one neuron; each dot denotes one swim cycle; gray dots represent swim cycles in which the neuron was not recruited, and purple or blue dots represent swim cycles in which the neuron was recruited, respectively. (D) Recruitment probability of medial vGlut2+ (purple) and lateral vGlut1+ (blue) nMLF neurons in relation to swim frequency. Shaded area indicates 95% confidence interval. Medial vGlut2+ neurons are recruited already at low swim frequencies (n = 20 neurons; N = 16 fish); lateral vGlut1+ neurons are sequentially recruited with increasing swim frequencies (n = 17 neurons; N = 13 fish). (E) Location of the recorded neurons in the nMLF. The location of each neuron is indicated by a dot, and each neuron is colored according to its activity during swimming as in (A) and (B). Neuron location was measured relative to midline and MeLr and normalized to the midline-MeLr distance to adjust for size differences between fish (MeLr indicated as a bigger circle with multiple colors). |

Econding swim onset, speed, and duration in the nMLF (A) Activity of nMLF neurons during slow swim episodes. Top panel: EMG recording of a slow swim episode with small muscle units. Middle panel: medial vGlut2+ neurons are recruited prior to the onset of the swim episode and maintain their recruitment during the duration of the episode (Peri-stimulus time histograms [PSTHs], bin width = 0.01 s). Bottom panel: lateral vGlut1+ neurons are not recruited during slow swim episodes. (B) Transition between slow and fast swim speeds. Top panel: EMG recording of an episode with a switch from slow to fast swim. Middle panel: medial vGlut2+ neurons increase their activity when the swim switches from slow to fast swim. Bottom panel: lateral vGlut1+ become recruited only during fast swim speed characterized with the onset of large muscle units. (C) Start and end of a fast swim episode. Top panel: EMG recording of a fast swim episode with larger muscle units active at high swim frequency. Middle panel: medial vGlut2+ neurons are active before the onset of the fast swim episode and display a strong activity increase at the onset with fast swim episode. Bottom panel: lateral vGlut1+ neurons become active shortly prior to the onset of the fast swim episode characterized with large muscle units. |
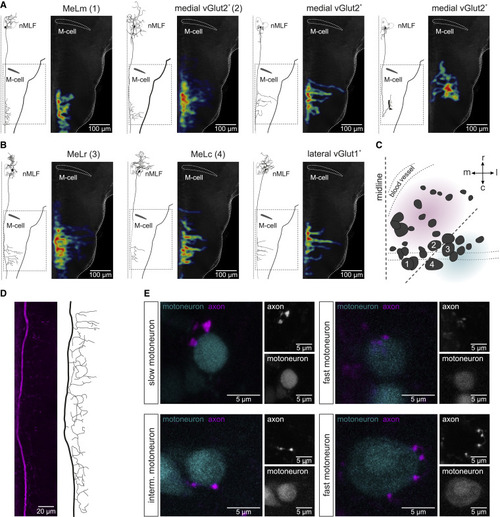
Pattern of projection of nMLF neurons (A) Morphologies and collateral projections in hindbrain of four medial vGlut2+ nMLF neurons. For each neuron type, the left panel shows reconstruction of a single neuron and the right panel shows heatmap of the collaterals of all recorded neurons. (B) Morphologies and collateral projections in hindbrain of three lateral vGlut1+ nMLF neurons. For each neuron type, the left panel shows reconstruction of a single neuron and the right panel shows heatmap of the collaterals of all recorded neurons. (C) Location of the analyzed neurons in the nMLF showing the soma position of four large neurons (1, MeLm; 2, large medial neuron; 3, MeLr; 4, MeLc). (D) Confocal image and reconstruction of the axonal projection of an nMLF neuron in the rostral spinal cord. (E) Close contacts between axon collaterals of nMLF neurons and motoneurons of the slow, intermediate, and fast modules. |

Selective behavioral outcome of medial and lateral nMLF neuron ablation (A) Tracked sequences of spontaneous explorative slow swimming in vivo in a control zebrafish and following ablation of medial vGlut2+ or lateral vGlut1+ nMLF neurons. Bottom panels: instantaneous swimming velocity in control fish (black) and in experimental fish in which the medial vGlut2+ (purple) or lateral vGlut1+ (blue) nMLF neurons were ablated. (B) Cumulative distributions of the swim velocity in control (black) and medial neuron-ablated zebrafish (purple) (∗∗∗p < 0.001; Kolmogorov-Smirnov test). (C) Cumulative distributions of the swim velocity in control (black) and lateral neuron-ablated fish (blue) (ns: p > 0.05; Kolmogorov-Smirnov test). (D) Graph showing the number of spontaneous swim episodes in control (N = 10 fish), medial neuron-ablated (N = 9 fish), and lateral neuron-ablated (N = 10 fish) zebrafish (the boxes are bound by the 25th and 75th percentiles, whiskers extend from min. to max.; ∗p < 0.05; repeated measures one-way ANOVA; size effect Cohen’s d = 1.85). (E) Graph showing the swim distance in control (N = 10 fish), in medial neuron-ablated (N = 9 fish), and lateral neuron-ablated (N = 10 fish) zebrafish (the boxes are bound by the 25th and 75th percentiles, whiskers extend from min. to max.; ∗∗p < 0.01; repeated measures one-way ANOVA; size effect Cohen’s d = 2.04). (F) Tracked sequences of fast swimming following sound-induced escape behavior in vivo, in a control fish and following ablation of medial vGlut2+ nMLF neurons. (G) Plot of swim velocity versus frequency in control and in medial neuron-ablated fish (black dots: control, n = 119 cycles from N = 5 fish; purple dots: ablation, n = 58 cycles from N = 6 fish). (H) Cumulative distribution of swim velocity in control and in medial neuron-ablated fish (∗∗∗p < 0.001; Kolmogorov-Smirnov test). (I) Tracked sequences of fast swimming following sound-induced escape behavior in vivo, in a control fish and following ablation of lateral vGlut1+ nMLF neurons. (J) Plot of swim velocity versus frequency in control and in lateral neuron-ablated fish (black dots: control, n = 119 cycles from N = 5 fish; purple dots: ablation, n = 118 cycles from N = 6 fish). (K) Cumulative distribution of swim velocity in control and in lateral neuron-ablated fish (∗∗∗p < 0.001; Kolmogorov-Smirnov test). |