
|
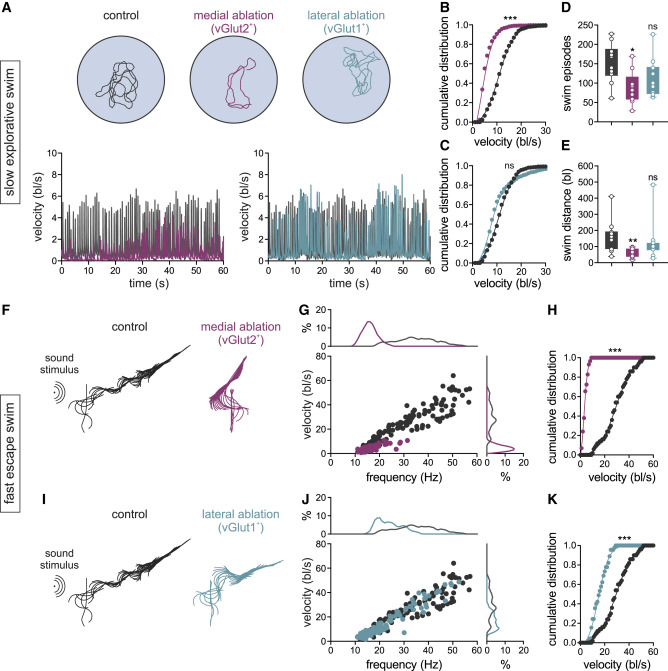
Fig. 7 Selective behavioral outcome of medial and lateral nMLF neuron ablation
(A) Tracked sequences of spontaneous explorative slow swimming in vivo in a control zebrafish and following ablation of medial vGlut2+ or lateral vGlut1+ nMLF neurons. Bottom panels: instantaneous swimming velocity in control fish (black) and in experimental fish in which the medial vGlut2+ (purple) or lateral vGlut1+ (blue) nMLF neurons were ablated.
(B) Cumulative distributions of the swim velocity in control (black) and medial neuron-ablated zebrafish (purple) (∗∗∗p < 0.001; Kolmogorov-Smirnov test).
(C) Cumulative distributions of the swim velocity in control (black) and lateral neuron-ablated fish (blue) (ns: p > 0.05; Kolmogorov-Smirnov test).
(D) Graph showing the number of spontaneous swim episodes in control (N = 10 fish), medial neuron-ablated (N = 9 fish), and lateral neuron-ablated (N = 10 fish) zebrafish (the boxes are bound by the 25th and 75th percentiles, whiskers extend from min. to max.; ∗p < 0.05; repeated measures one-way ANOVA; size effect Cohen’s d = 1.85).
(E) Graph showing the swim distance in control (N = 10 fish), in medial neuron-ablated (N = 9 fish), and lateral neuron-ablated (N = 10 fish) zebrafish (the boxes are bound by the 25th and 75th percentiles, whiskers extend from min. to max.; ∗∗p < 0.01; repeated measures one-way ANOVA; size effect Cohen’s d = 2.04).
(F) Tracked sequences of fast swimming following sound-induced escape behavior in vivo, in a control fish and following ablation of medial vGlut2+ nMLF neurons.
(G) Plot of swim velocity versus frequency in control and in medial neuron-ablated fish (black dots: control, n = 119 cycles from N = 5 fish; purple dots: ablation, n = 58 cycles from N = 6 fish).
(H) Cumulative distribution of swim velocity in control and in medial neuron-ablated fish (∗∗∗p < 0.001; Kolmogorov-Smirnov test).
(I) Tracked sequences of fast swimming following sound-induced escape behavior in vivo, in a control fish and following ablation of lateral vGlut1+ nMLF neurons.
(J) Plot of swim velocity versus frequency in control and in lateral neuron-ablated fish (black dots: control, n = 119 cycles from N = 5 fish; purple dots: ablation, n = 118 cycles from N = 6 fish).
(K) Cumulative distribution of swim velocity in control and in lateral neuron-ablated fish (∗∗∗p < 0.001; Kolmogorov-Smirnov test).