
|
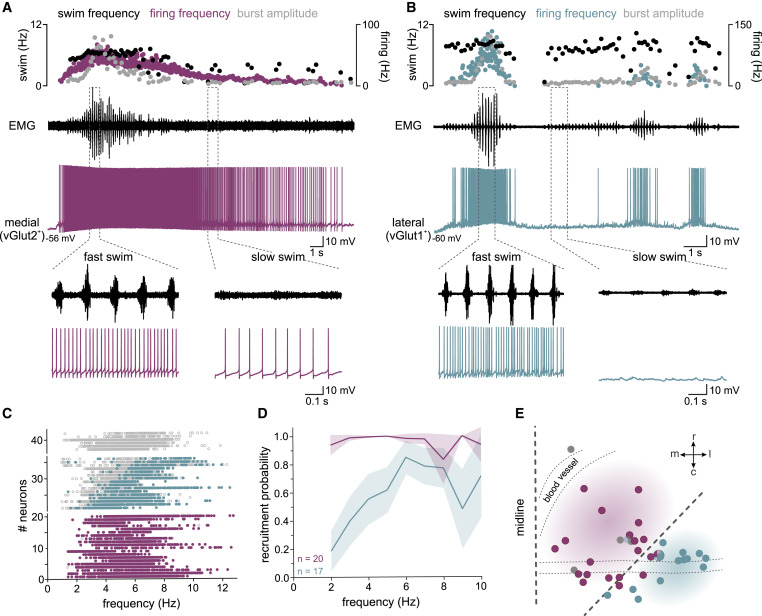
Fig. 4 Activity of nMLF neuron subpopulations coding onset, duration, and speed of swimming
(A) Recording of a medial vGlut2+ nMLF neuron (purple trace) recruited throughout a whole swim episode monitored by recording muscle activity (black trace). Upper panel: graph shows the instantaneous swim frequency (black dots, each dot denotes one swim cycle), the instantaneous neuronal firing frequency (purple dots, ISF in Hz), and the muscle burst amplitude (gray dots). Bottom panels: expanded traces indicated by dashed lines showing a difference in firing frequency of the recorded medial vGlut2+ nMLF neuron at slow versus fast swim activity.
(B) Recording of a lateral vGlut1+ nMLF neuron (blue trace) recruited only during high swim speed (black trace). Upper panel: graph shows instantaneous swim frequency (black dots, each dot denotes one swim cycle), instantaneous neuronal firing frequency (blue dots, ISF in Hz), and the corresponding muscle burst amplitude (gray dots, each dot denotes one swim cycle). Bottom panel: expanded traces indicated by the dashed lines showing that the recorded lateral vGlut1+ nMLF neuron is recruited only during fast but not slow swimming.
(C) Recruitment of medial vGlut2+ (purple dots) and lateral vGlut1+ (blue dots) nMLF neurons in relation to the swim frequency. Each line shows the recruitment of one neuron; each dot denotes one swim cycle; gray dots represent swim cycles in which the neuron was not recruited, and purple or blue dots represent swim cycles in which the neuron was recruited, respectively.
(D) Recruitment probability of medial vGlut2+ (purple) and lateral vGlut1+ (blue) nMLF neurons in relation to swim frequency. Shaded area indicates 95% confidence interval. Medial vGlut2+ neurons are recruited already at low swim frequencies (n = 20 neurons; N = 16 fish); lateral vGlut1+ neurons are sequentially recruited with increasing swim frequencies (n = 17 neurons; N = 13 fish).
(E) Location of the recorded neurons in the nMLF. The location of each neuron is indicated by a dot, and each neuron is colored according to its activity during swimming as in (A) and (B). Neuron location was measured relative to midline and MeLr and normalized to the midline-MeLr distance to adjust for size differences between fish (MeLr indicated as a bigger circle with multiple colors).