
- Title
-
A conserved megaprotein-based molecular bridge critical for lipid trafficking and cold resilience
- Authors
- Wang, C., Wang, B., Pandey, T., Long, Y., Zhang, J., Oh, F., Sima, J., Guo, R., Liu, Y., Zhang, C., Mukherjee, S., Bassik, M., Lin, W., Deng, H., Vale, G., McDonald, J.G., Shen, K., Ma, D.K.
- Source
- Full text @ Nat. Commun.
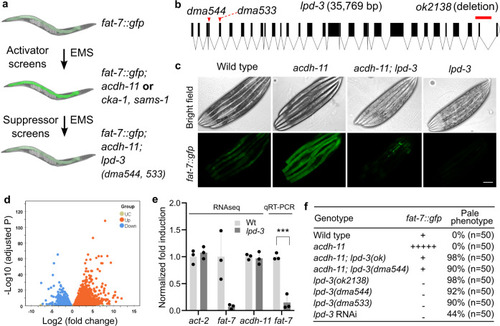
a Schematic of genetic screens that led to the identification of acdh-11, cka-1, and sams-1 as negative regulators of fat-7 and acdh-11-suppressing lpd-3 as positive regulator of fat-7. b Full-length gene diagram of lpd-3 with the point mutations dma544, dma533 (arrows) and deletion mutation ok2138 (line). c Representative images of fat-7::GFP animals in wild type, acdh-11(n5857) single, acdh-11(n5857); lpd-3(ok2138) double, or lpd-3(ok2138) single mutants. Scale bar, 50 µm. d Volcano plot showing significantly (adjusted p value < 0.05, Wald test in DESeq2) up- (orange) or down- (blue) regulated genes in lpd-3 mutants compared with wild type. e Normalized fold induction (RNAseq and qRT-PCR) of fat-7 showing its diminished expression in lpd-3 mutants. Values are means ± S.D. ***P < 0.001 (N = 3 biological replicates, P = 0.0006 from two-sided unpaired t-test). f Table summary of fat-7::GFP abundance (indicated by relative numbers of plus signs based on fluorescent intensities or minus sign, no signals) and the morphological pale phenotypes in animals with indicated genotypes (single, double mutations or RNAi) and phenotypic penetrance. Source data are provided as a Source Data file. |
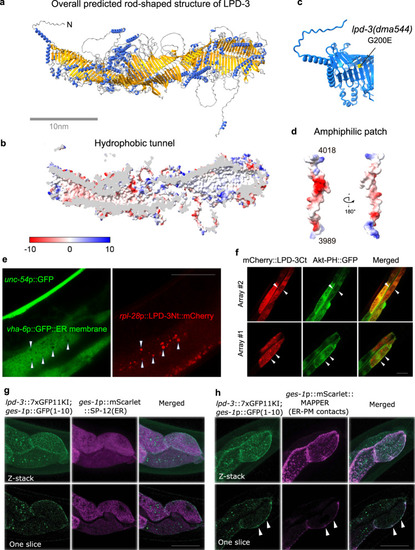
a Overall structure of the full-length LPD-3 assembled from four segments whose structures were separately predicted by AlphaFold v2.0, with both N and C-termini noted. b Cross-sectional view of the LPD-3 structure showing the hydrophobic tunnel running continuously along the entire inside. c Ribbon representation of the N-terminal part of LPD-3, with the G200E mutation indicated in yellow. d Structure of the LPD-3 C-terminus showing an amphiphilic patch (hydrophobic, red; hydrophilic, blue) that was used to generate mCherry-fused LPD-3 reporters. e Representative fluorescence images showing co-localization (arrow heads) of ER membrane markers with a mCherry fusion reporter of the LPD-3 N-terminus (rpl-28p::LPD-3Nt::mCherry with LPD-3 a.a. 1-72, unc-54p::GFP as co-injection marker). f Representative fluorescence images (from two independent transgenic extrachromosomal arrays #1 and #2) showing co-localization (arrow heads) of Akt-PH::GFP that binds to PM-PIP3 with a mCherry fusion reporter (ges-1p::mCherry::LPD-3Ct, a.a. 3945-4018) of the LPD-3 C-terminus. g Representative confocal fluorescence images showing endogenous LPD-3::GFP (generated by CRISPR/Cas9-mediated knock-in and split GFP complementation) in apposition with mScarlet::SP-12(ER). h Representative confocal fluorescence images showing endogenous LPD-3::GFP that co-localizes (arrow heads) with mScarlet::MAPPER, a marker for ER-PM junctions. Scale bar, 50 µm. |
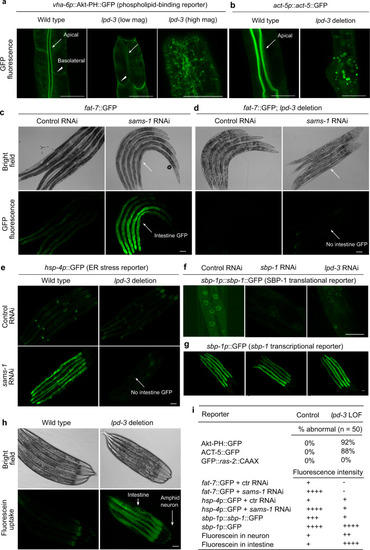
a Representative confocal fluorescence images showing PIP3-binding Akt-PH::GFP reporters in wild type (apical intestinal membrane, arrow; basolateral membrane, arrow head) and lpd-3(ok2138) mutants at both low and high magnifications. b Representative confocal fluorescence images showing the actin reporter act-5p::act-5::GFP in wild type (apical intestinal membrane, arrow) and lpd-3(ok2138) mutants. c Representative bright-field and epifluorescence images showing activation of fat-7::GFP by RNAi against sams-1. d Representative bright-field and epifluorescence images showing activation of fat-7::GFP by RNAi against sams-1 in wild type but not lpd-3(ok2138) mutants (arrow). e Representative epifluorescence images showing activation of the hsp-4p::GFP ER stress reporter by RNAi against sams-1 in wild type but not lpd-3(ok2138) mutants (arrow). f Representative confocal fluorescence images showing reduced abundance of nuclear sbp-1p::sbp-1::GFP by RNAi against sbp-1 or lpd-3. g Representative epifluorescence images showing no apparent changes of sbp-1p::GFP by RNAi against sbp-1 or lpd-3. h Representative epifluorescence images showing markedly increased membrane permeability for fluorescein in lpd-3(ok2138) mutants. i Table summary of reporter phenotypes of indicated genotypes or conditions. Scale bars, 50 µm. |
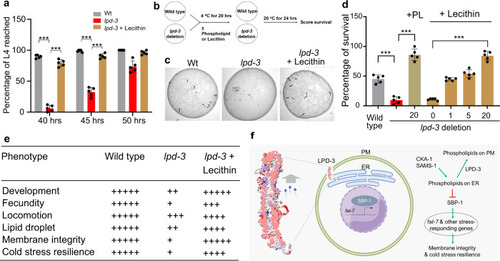
a Percentages of animals that reached developmental L4 stage at indicated hours post egg preparation in wild type, lpd-3(ok2138) mutants with or without supplementation of Lecithin since egg preparation. Values are means ± S.D. ***P < 0.001 (two-way ANOVA followed by multiple two-sided unpaired t-tests, N = 5 biological replicates). b Schematic of the experiment to measure cold resilience of wild type and lpd-3(ok2138) mutants with supplementation of soy phospholipids or Lecithin for 6 hrs post developmental L4 stage. c Representative bright-field images showing markedly decreased survival of lpd-3(ok2138) mutants against cold exposure (4 °C for 20 h) and rescued survival by Lecithin supplementation. Scale bars, 100 µm. d Percentages of survived animals against cold exposure (4 °C for 20 h) with indicated genotypes and increasing doses of Lecithin or soy phospholipids (PL) that rescued lpd-3 mutants. Values are means ± S.D. ***P < 0.001 (one-way ANOVA followed by multiple two-sided unpaired t-tests, N = 5 biological replicates). e Table summary of observed lpd-3 phenotypes and their degrees of rescue (indicated by the numbers of + signs) by Lecithin (10 mg/ml on NGM). f Model to illustrate molecular functions of LPD-3 in mediating non-vesicular ER-to-PM lipid trafficking, antagonizing effects of CKA-1 and SAMS-1 on lipids at ER membranes, and regulation of genes including fat-7 through SBP-1. Other components of the pathway are omitted for clarity. Source data are provided as a Source Data file. |
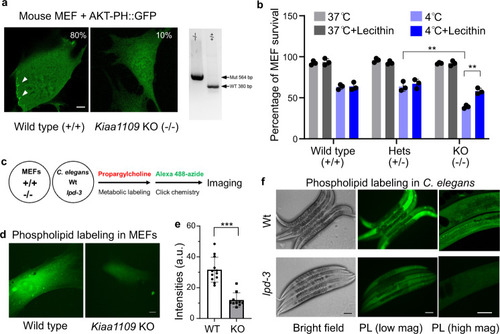
a Representative confocal fluorescence images showing enriched AKT-PH::GFP localization to ruffling membranes at cell periphery in wild-type (80%, n = 20) but less in Kiaa1109 KO (10%, n = 20) MEFs. b Quantification of cell survival rates of MEFs based on SYTOX blue staining with indicated genotypes (wild type, heterozygous and homozygous knock-out of Kiaa1109 in MEFs) after cold stress treatment. Values are means ± S.D with **P < 0.01 (N = 3 independent experiments, n > 700 cells per experiment; two-way ANOVA followed by multiple two-sided unpaired t-tests). c Schematic of metabolic phospholipid labeling using propargylcholine and click chemistry for visualization. d Representative confocal fluorescence images showing enriched propargylcholine signals with Alexa-488 fluorescence in wild-type and Kiaa1109 KO MEFs. e Quantification of Alexa-488 fluorescence intensities (a.u., arbitrary unit) of propargylcholine-labelled phospholipids in wild-type (n = 12) and Kiaa1109 KO (n = 10) MEFs. Values are means ± S.D with ***P < 0.001 (two-sided unpaired t-test). f Representative bright field and fluorescence images showing typical enriched propargylcholine staining signals in wild type and lpd-3(ok2138) mutants. Scale bars, 50 µm. Source data are provided as a Source Data file. |

ZFIN is incorporating published figure images and captions as part of an ongoing project. Figures from some publications have not yet been curated, or are not available for display because of copyright restrictions. |