
Fig. 2
- ID
- ZDB-IMAGE-221118-29
- Publication
- Wang et al., 2022 - A conserved megaprotein-based molecular bridge critical for lipid trafficking and cold resilience
- All Figures
- Figures for Wang et al., 2022
|
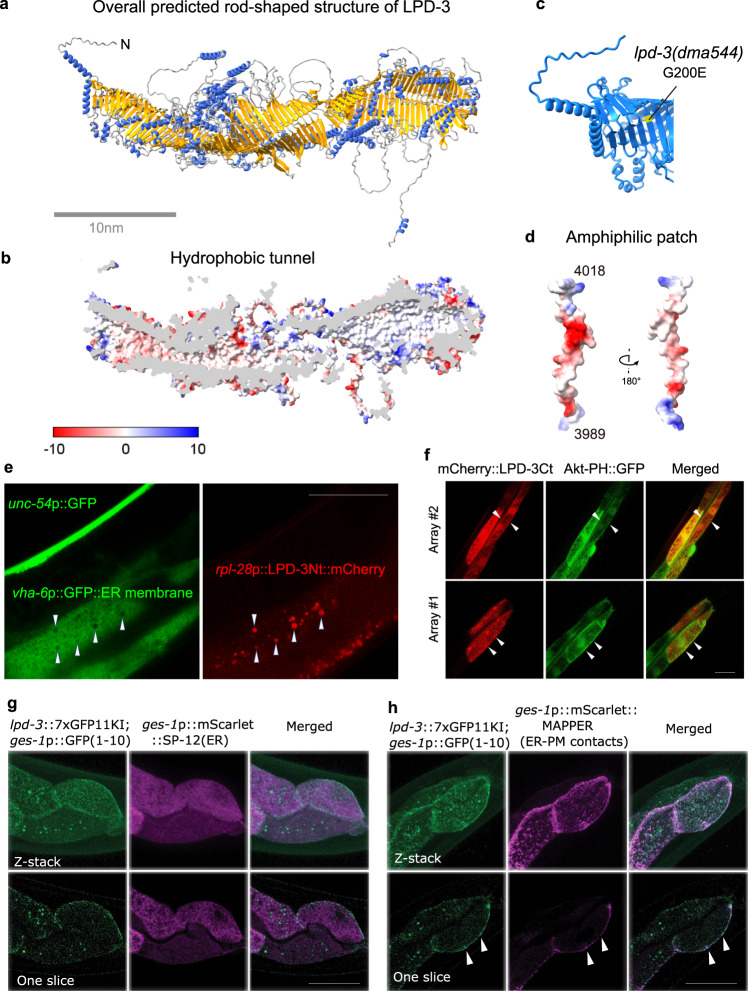
Fig. 2 a Overall structure of the full-length LPD-3 assembled from four segments whose structures were separately predicted by AlphaFold v2.0, with both N and C-termini noted. b Cross-sectional view of the LPD-3 structure showing the hydrophobic tunnel running continuously along the entire inside. c Ribbon representation of the N-terminal part of LPD-3, with the G200E mutation indicated in yellow. d Structure of the LPD-3 C-terminus showing an amphiphilic patch (hydrophobic, red; hydrophilic, blue) that was used to generate mCherry-fused LPD-3 reporters. e Representative fluorescence images showing co-localization (arrow heads) of ER membrane markers with a mCherry fusion reporter of the LPD-3 N-terminus (rpl-28p::LPD-3Nt::mCherry with LPD-3 a.a. 1-72, unc-54p::GFP as co-injection marker). f Representative fluorescence images (from two independent transgenic extrachromosomal arrays #1 and #2) showing co-localization (arrow heads) of Akt-PH::GFP that binds to PM-PIP3 with a mCherry fusion reporter (ges-1p::mCherry::LPD-3Ct, a.a. 3945-4018) of the LPD-3 C-terminus. g Representative confocal fluorescence images showing endogenous LPD-3::GFP (generated by CRISPR/Cas9-mediated knock-in and split GFP complementation) in apposition with mScarlet::SP-12(ER). h Representative confocal fluorescence images showing endogenous LPD-3::GFP that co-localizes (arrow heads) with mScarlet::MAPPER, a marker for ER-PM junctions. Scale bar, 50 µm.