
|
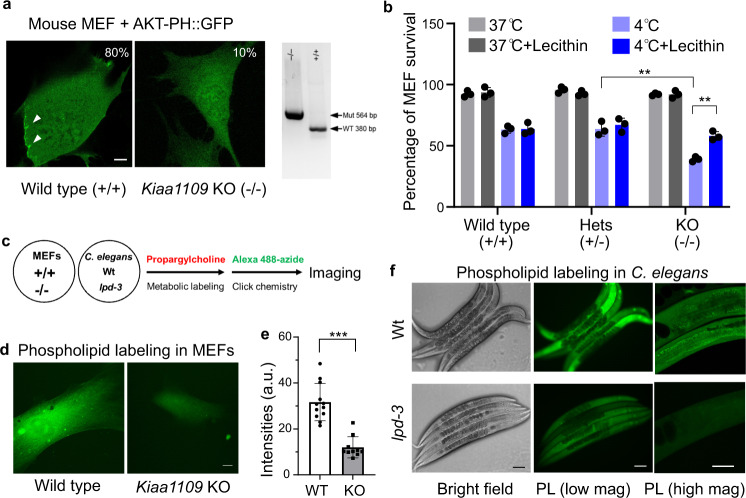
Fig. 5 a Representative confocal fluorescence images showing enriched AKT-PH::GFP localization to ruffling membranes at cell periphery in wild-type (80%, n = 20) but less in Kiaa1109 KO (10%, n = 20) MEFs. b Quantification of cell survival rates of MEFs based on SYTOX blue staining with indicated genotypes (wild type, heterozygous and homozygous knock-out of Kiaa1109 in MEFs) after cold stress treatment. Values are means ± S.D with **P < 0.01 (N = 3 independent experiments, n > 700 cells per experiment; two-way ANOVA followed by multiple two-sided unpaired t-tests). c Schematic of metabolic phospholipid labeling using propargylcholine and click chemistry for visualization. d Representative confocal fluorescence images showing enriched propargylcholine signals with Alexa-488 fluorescence in wild-type and Kiaa1109 KO MEFs. e Quantification of Alexa-488 fluorescence intensities (a.u., arbitrary unit) of propargylcholine-labelled phospholipids in wild-type (n = 12) and Kiaa1109 KO (n = 10) MEFs. Values are means ± S.D with ***P < 0.001 (two-sided unpaired t-test). f Representative bright field and fluorescence images showing typical enriched propargylcholine staining signals in wild type and lpd-3(ok2138) mutants. Scale bars, 50 µm. Source data are provided as a Source Data file.