
- Title
-
PCSK9 Confers Inflammatory Properties to Extracellular Vesicles Released by Vascular Smooth Muscle Cells
- Authors
- Greco, M.F., Rizzuto, A.S., Zarà, M., Cafora, M., Favero, C., Solazzo, G., Giusti, I., Adorni, M.P., Zimetti, F., Dolo, V., Banfi, C., Ferri, N., Sirtori, C.R., Corsini, A., Barbieri, S.S., Pistocchi, A., Bollati, V., Macchi, C., Ruscica, M.
- Source
- Full text @ Int. J. Mol. Sci.
|
Characterization of vascular smooth muscle cells (VSMCs). (A) Generation of VSMCs overexpressing PCSK9 by using a pBMN-IRES-puromycin vector carrying human PCSK9 coding sequence. FLAG peptide has the following sequence Asp-Tyr-Lys-Asp-Asp-Asp-Asp-Lys; PURO stands for puromycin; IRES stands for internal ribosome entry site; LTR stands for long terminal repeat. Protein expression of FLAG was assessed by WB analysis. β-actin was used as a housekeeping protein. Representative image of three independent experiments. (B) Gene (quantitative PCR) and protein expression (WB) of PCSK9 in VSMCs. 36B4 was used as a reference gene and β-Actin was used as a housekeeping protein. For WB, the reported blot is representative of three independent experiments. (C) Data obtained from the ELISA assay are expressed as % of PCSK9 released in the cell culture medium of VSMCsPCSK9 compared to VSMCsWT; the results were normalized for the total protein content. n = 6 per group. (D) Proliferative assay of VSMCs (cell counting). n = 6 per group. (E) VSMCs were cultured in standard conditions for seven days and the morphology was evaluated by optical microscopy [17]. (F) Gene expression of VSMC markers(Acta2 and Calponin). β-Actin was used as a reference gene. n = 6 per group. (G) Gene ontology enrichment analysis relative to proteins with a significantly higher expression in VSMCsPCSK9. Red bar represents VSMCsPCSK9 and white bar represents VSMCsWT. Results are expressed relative to the normal control and as mean ± SEM. Differences between groups have been assessed by t-test. * p < 0.05, ** p < 0.01, *** p < 0.001 vs. control. Acta2, alpha-actin-2; PCSK9, proprotein convertase subtilisin/kexin type 9; VSMCs, vascular smooth muscle cell; VSMCsPCSK9, vascular smooth muscle cells overexpressing PCSK9; VSMCsWT, vascular smooth muscle cells wildtype; WB, Western blot. 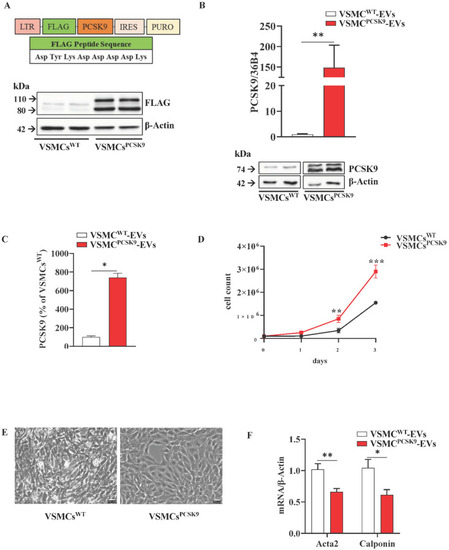

|
|
Phenotypic characterization of extracellular vesicles (EVs). (A) Cell viability of VSMCs supplemented or not with FBS was assessed by annexin V/propidium iodide double staining. n = 9 per group. (B) EV concentrations are expressed as means for each size for the VSMCPCSK9-EVs (dashed line) and VSMCWT-EVs (solid line). EV concentrations were calculated as marginal means from negative binomial regression models. n = 6 derived from 6 different experiments. (C) p-value and False Discovery Rate p-value of the comparisons of each size EV for the entire 30–700 nm size range are reported. n = 6 derived from 6 different experiments. (D) Representative ultrastructural images of EVs by TEM. For both, the main image shows an EV whose size is compatible with intermediate EVs, and the insert shows an EV whose size is compatible with small EVs (arrow). Scale bar = 100 nm. (E) The expression of tetraspanins CD9 and CD63 was evaluated by flow cytometry analysis in EVs. Representative panels of three independent experiments. (F) Protein expression of β1-integrin and Alix as assessed by WB in EVs. Representative blots of three independent experiments. (G) PCSK9 expression in VSMCWT-EVs and VSMCPCSK9-EVs through WB analysis. Representative blot of three independent experiments. VSMCPCSK9-EVs are those released by VSMCPCSK9 and VSMCWT-EVs are those released by VSMCsWT. EV, extracellular vesicles; FBS, foetal bovine serum; VSMCPCSK9-EVs, EVs released by VSMCs overexpressing PCSK9; VSMCWT-EVs, EVs released by VSMCs wildtype; TEM, Transmission electron microscopy; WB, Western blot. 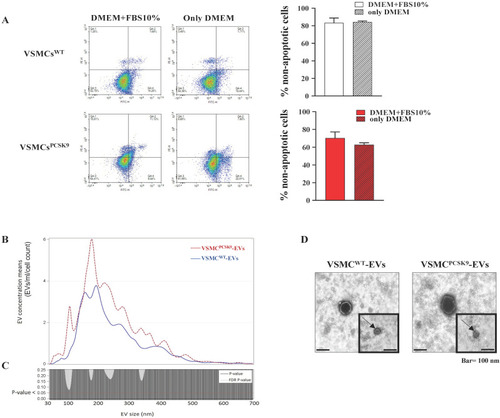
|

Characterization of EVs cargo. (A) Gene ontology enrichment analysis relative to proteins with a significantly higher expression in VSMCPCSK9-EVs. (B) Volcano plot of miRNA with a significantly different expression between VSMCPCSK9-EVs and VSMCWT-EVs. (C) Venn diagram of miRNAs targets. All predicted genes for the differentially expressed miRNAs were filtered according to their relationship with atherosclerosis and inflammation and were selected for checking gene targets overlap. Results show t miRNAs target common genes. EVs, extracellular vesicles; VSMCPCSK9-EVs, EVs released by VSMCs overexpressing PCSK9; VSMCWT-EVs, EVs released by VSMCs wildtype. |
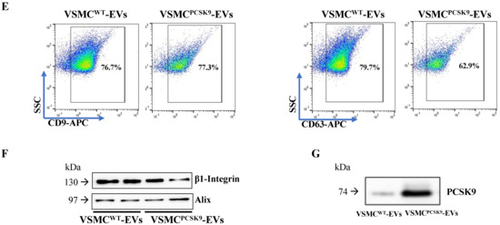
Impact of extracellular vesicles (EVs) on endothelial cells, THP-1, and THP-1-derived macrophages. (A) Plots and bar graphs show the uptake of VSMCPCSK9-EVs and VSMCWT-EVs by target cells (THP-1) assessed by flow cytometry. n = 3 per group. (B) Gene expression of pro-inflammatory cytokine IL-6 and cell adhesion molecules (VCAM-1, ET-1, ICAM-1 and E-selectin) in EA.hy926 endothelial cells. n = 6 per group. (C,D) Gene expression of pro-inflammatory cytokines and chemokines (IL-1β, IL-1α, IL-6, IL-8 and CCL2) in THP-1 monocytes (C) and in THP-1 derived macrophages (D) after treatment with VSMCPCSK9-EVs and VSMCWT-EVs. 18S (B) and 36B4 (C,D) were used as reference genes. n = 6 per group. E-F) Protein expression of pSTAT3 and SOCS3 as assessed by WB analysis in THP-1 monocytes (E) and THP-1 derived macrophages (F). Tubulin (E) and β-actin (F) were used as housekeeping proteins. Representative blot of three independent experiments. (G) Proteomic and GO analysis of secreted proteins from THP-1 cells incubated with VSMCPCSK9-EVs. Red line and bar represent cells exposed to VSMCPCSK9-EVs; black line and white bar represent cells exposed to VSMCWT-EVs. Results are expressed relative to the normal control and as mean ± SEM. Differences between groups have been assessed by t-test. * p < 0.05, ** p < 0.01, *** p < 0.001, ****p < 0.0001 vs. control. EVs, extracellular vesicles; VSMCPCSK9-EVs, EVs released by VSMCs overexpressing PCSK9; VSMCWT-EVs, EVs released by VSMCs wildtype; SEM, standard error of the mean. |
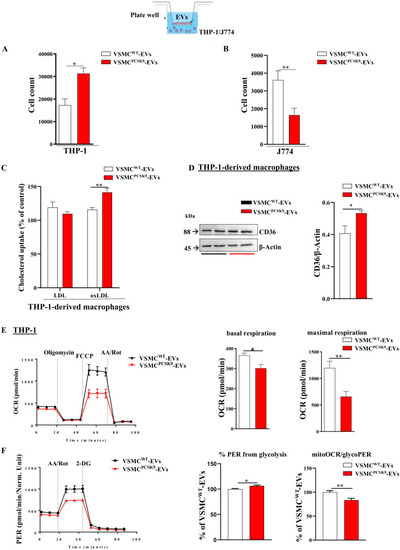
Cell migration, uptake of ox-LDL and mitochondrial respiration. (A) Migration of THP-1 upon exposure to EVs. n = 4 per group. (B) Migration of J774 macrophages upon exposure to EVs. n = 4 per group. (C) Uptake of oxLDL-derived cholesterol in THP-1 cells treated with EVs. n = 3 per group. (D) CD36 protein expression in THP-1-derived macrophages after exposure to VSMCPCSK9-EVs compared with VSMCWT-EVs as assessed by WB. β-actin was used as a housekeeping protein. Representative blot of three independent experiments. (E,F) Mitochondrial respiration function was assessed by Seahorse XFe24 analyser. Mitostress analysis (E) and glycolytic rate assay (F) were performed. Red line represents THP-1 exposed to VSMCsPCSK9-EVs; black line represents THP-1 exposed to VSMCWT-EVs. Results are expressed relative to the VSMCWT-EVs control. n = 5 per group. Differences between groups have been assessed by t-test. * p < 0.05, ** p < 0.01, versus control. EV, extracellular vesicles; VSMCPCSK9-EVs, EVs released by VSMCs overexpressing PCSK9; VSMCWT-EVs, EVs released by VSMCs wildtype; OCR, oxygen consumption rate; PER, proton efflux rate; FCCP, carbonyl cyanide p-trifluoromethoxy-phenylhydrazone; AA, Antimycin A; Rot, Rotenone; 2-DG, 2-deoxy-D-glucose; SEM, standard error of the mean. |
|
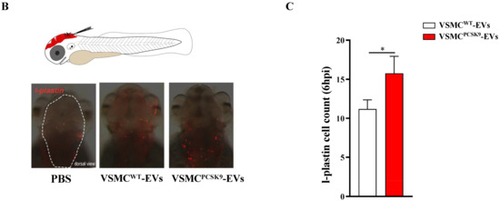
Systemic and local microinjection of extracellular (EVs) in embryos of zebrafish. (A) Gene expression of IL-1β and IL-8 evaluated 20 hpi of EVs in embryos. Data were expressed as mean ± SEM of at least two independent biological replicates; for IL-1β and IL-8 genes, statistical significance was assessed by one-way ANOVA test followed by Tukey’s post hoc correction. (B) Immuno-detection assay (anti-l-plastin) in brain ventricle area of embryos treated with EVs. A scheme of injection strategy is reported. Representative fluorescence overlaid with brightfield images shows macrophage recruitment (red) at injection site (dashed line) 6 h post-injection. (C) Macrophage quantification (l-plastin positive cells); the mean number of cells per embryo ± SEM are indicated (VSMCWT-EVs = 22, VSMCPCSK9-EVs = 17, from three biological replicates). Red bar represents the injection of VSMCPCSK9-EVs; white bar represents the injection with VSMCWT-EVs. Statistical significance was assessed by two-tailed unpaired t-test; scale bar 300 μm. * p < 0.05, ** p < 0.01. EVs, extracellular vesicles; hpi, hours post injection; IL, interleukin; SEM, standard error of the mean; VSMCPCSK9-EVs, EVs released by VSMCs overexpressing PCSK9; VSMCWT-EVs, EVs released by VSMCs wildtype. 
|