
|
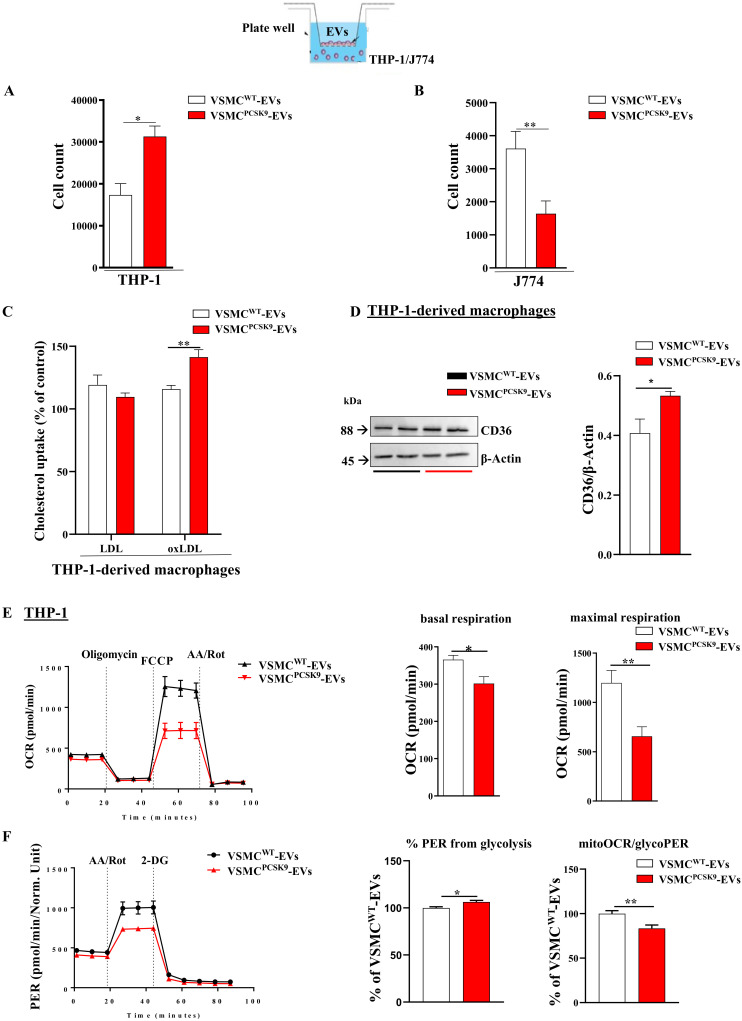
Figure 5 Cell migration, uptake of ox-LDL and mitochondrial respiration. (A) Migration of THP-1 upon exposure to EVs. n = 4 per group. (B) Migration of J774 macrophages upon exposure to EVs. n = 4 per group. (C) Uptake of oxLDL-derived cholesterol in THP-1 cells treated with EVs. n = 3 per group. (D) CD36 protein expression in THP-1-derived macrophages after exposure to VSMCPCSK9-EVs compared with VSMCWT-EVs as assessed by WB. β-actin was used as a housekeeping protein. Representative blot of three independent experiments. (E,F) Mitochondrial respiration function was assessed by Seahorse XFe24 analyser. Mitostress analysis (E) and glycolytic rate assay (F) were performed. Red line represents THP-1 exposed to VSMCsPCSK9-EVs; black line represents THP-1 exposed to VSMCWT-EVs. Results are expressed relative to the VSMCWT-EVs control. n = 5 per group. Differences between groups have been assessed by t-test. * p < 0.05, ** p < 0.01, versus control. EV, extracellular vesicles; VSMCPCSK9-EVs, EVs released by VSMCs overexpressing PCSK9; VSMCWT-EVs, EVs released by VSMCs wildtype; OCR, oxygen consumption rate; PER, proton efflux rate; FCCP, carbonyl cyanide p-trifluoromethoxy-phenylhydrazone; AA, Antimycin A; Rot, Rotenone; 2-DG, 2-deoxy-D-glucose; SEM, standard error of the mean.