
|
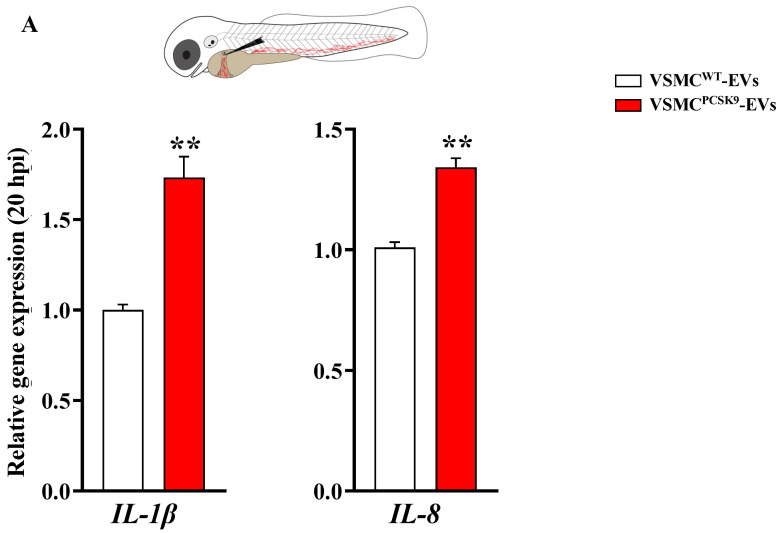
Figure 6 Systemic and local microinjection of extracellular (EVs) in embryos of zebrafish. (A) Gene expression of IL-1β and IL-8 evaluated 20 hpi of EVs in embryos. Data were expressed as mean ± SEM of at least two independent biological replicates; for IL-1β and IL-8 genes, statistical significance was assessed by one-way ANOVA test followed by Tukey’s post hoc correction. (B) Immuno-detection assay (anti-l-plastin) in brain ventricle area of embryos treated with EVs. A scheme of injection strategy is reported. Representative fluorescence overlaid with brightfield images shows macrophage recruitment (red) at injection site (dashed line) 6 h post-injection. (C) Macrophage quantification (l-plastin positive cells); the mean number of cells per embryo ± SEM are indicated (VSMCWT-EVs = 22, VSMCPCSK9-EVs = 17, from three biological replicates). Red bar represents the injection of VSMCPCSK9-EVs; white bar represents the injection with VSMCWT-EVs. Statistical significance was assessed by two-tailed unpaired t-test; scale bar 300 μm. * p < 0.05, ** p < 0.01. EVs, extracellular vesicles; hpi, hours post injection; IL, interleukin; SEM, standard error of the mean; VSMCPCSK9-EVs, EVs released by VSMCs overexpressing PCSK9; VSMCWT-EVs, EVs released by VSMCs wildtype.