
|
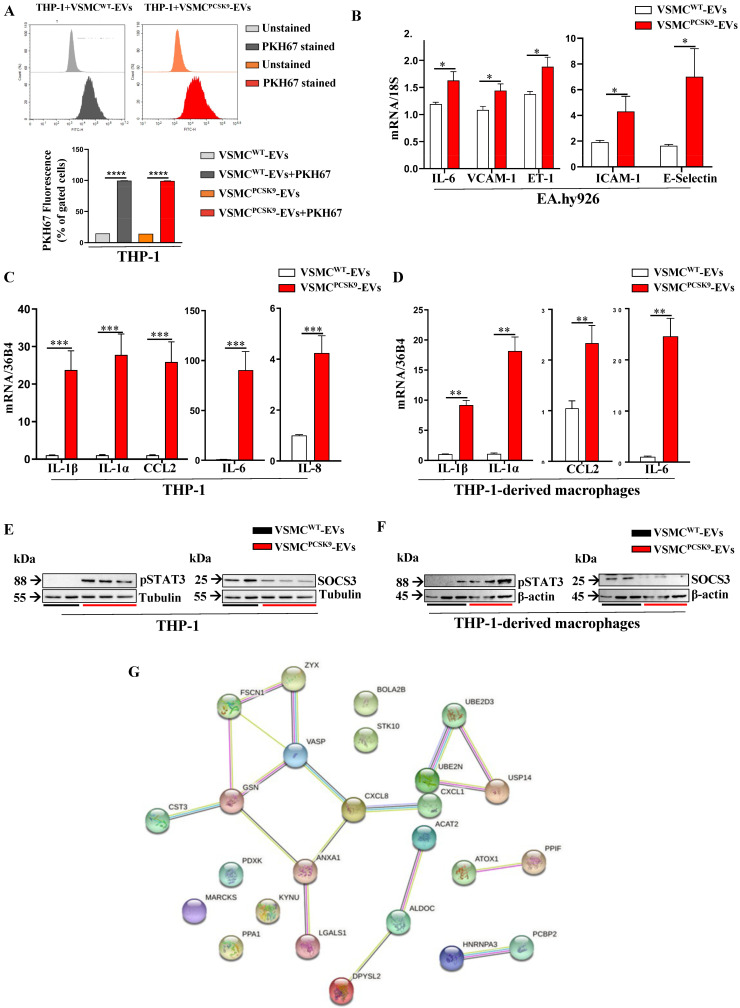
Figure 4 Impact of extracellular vesicles (EVs) on endothelial cells, THP-1, and THP-1-derived macrophages. (A) Plots and bar graphs show the uptake of VSMCPCSK9-EVs and VSMCWT-EVs by target cells (THP-1) assessed by flow cytometry. n = 3 per group. (B) Gene expression of pro-inflammatory cytokine IL-6 and cell adhesion molecules (VCAM-1, ET-1, ICAM-1 and E-selectin) in EA.hy926 endothelial cells. n = 6 per group. (C,D) Gene expression of pro-inflammatory cytokines and chemokines (IL-1β, IL-1α, IL-6, IL-8 and CCL2) in THP-1 monocytes (C) and in THP-1 derived macrophages (D) after treatment with VSMCPCSK9-EVs and VSMCWT-EVs. 18S (B) and 36B4 (C,D) were used as reference genes. n = 6 per group. E-F) Protein expression of pSTAT3 and SOCS3 as assessed by WB analysis in THP-1 monocytes (E) and THP-1 derived macrophages (F). Tubulin (E) and β-actin (F) were used as housekeeping proteins. Representative blot of three independent experiments. (G) Proteomic and GO analysis of secreted proteins from THP-1 cells incubated with VSMCPCSK9-EVs. Red line and bar represent cells exposed to VSMCPCSK9-EVs; black line and white bar represent cells exposed to VSMCWT-EVs. Results are expressed relative to the normal control and as mean ± SEM. Differences between groups have been assessed by t-test. * p < 0.05, ** p < 0.01, *** p < 0.001, ****p < 0.0001 vs. control. EVs, extracellular vesicles; VSMCPCSK9-EVs, EVs released by VSMCs overexpressing PCSK9; VSMCWT-EVs, EVs released by VSMCs wildtype; SEM, standard error of the mean.