
- Title
-
Skeletal Class III Malocclusion Is Associated with ADAMTS2 Variants and Reduced Expression in a Familial Case
- Authors
- Yao, S., Zhou, X., Vona, B., Fan, L., Zhang, C., Li, D., Yuan, H., Du, Y., Ma, L., Pan, Y.
- Source
- Full text @ Int. J. Mol. Sci.
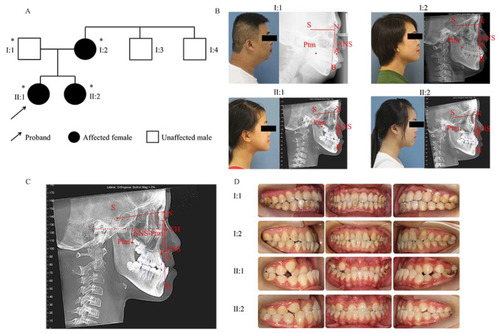
Pedigree and characterization of the skeletal Class III malocclusion. (A) Pedigree of the family. Asterisks represent participating family members. The proband (II:1) is a 12-year-old girl with skeletal Class III malocclusion. The arrow indicates the proband. (B) Profiles and lateral cephalograms. (C) Cephalometric landmark points. FH: Frankfort horizontal plane; S: sella; N: nasion; A: subspinale; B: supramental, Ptm: pterygomaxillary fissure; ANS: anterior nasal spine. (D) Intraoral views of the family members. I:2, II:1, and II:2 all have similar phenotypes. |
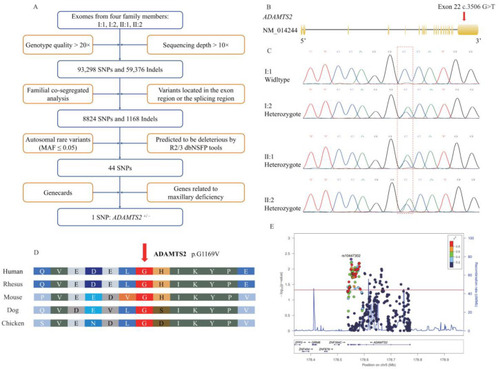
(A) Flow chart outlining selection of the causative variant. (B) Schematic diagram of the ADAMTS2 gene showing the localization of the variant identified in this pedigree. (C) Sanger sequencing validation of the heterozygous c.3506G>T variant in the ADAMTS2 gene shows individuals I:2, II:1, and II:2 are heterozygous and I:1 is wild type. Red dotted frame indicates the position of causative variants. (D) Conservation of each amino acid residue across species is shown. The red arrow indicates the mutated amino acid. Glycine at position 1169 is conserved. (E) Regional plot of the association between ADAMTS2 and maxillary deficiency by logistic regression analysis. x-axis is the physical position in Mb with arrows denoting genes and expressed sequence tags in the region, the left y-axis plots the –log (p-value), and the right y-axis plots the CEPH recombination rate. The red horizontal line represents p = 0.05. |

Phenotype in adamts2-knockdown zebrafish. (A) Zebrafish larvae were imaged in lateral positions with transmitted light at 48 hpf, 72 hpf, and 96 hpf. (B,C) Schematic diagram of zebrafish craniofacial structure from ventral view and lateral view: (bh) basihyal; (ch) ceratohyal; (co) coracoids of pectoral girdle; (cb) ceratobranchial; (c) cleithrum; (ep) ethmoid plate; (hs) hyosymplectic; (m) Meckel’s cartilage; (oa) occipital arch; (pp) pterygoid process of the palatoquadrate; (pq) palatoquadrate. (D,E) Control and (F,G) adamts2-knockdown zebrafish at 144 hpf were stained with Alcian blue to observe craniofacial cartilage structures from ventral and dorsal view. The red double arrow represents the measurement method of related indicators. (H) Ethmoid plate length and width; (I) palatoquadrate length; (J) Meckel’s cartilage length and width. (K) Scatter histogram showing change of palatoquadrate length, as well as length and width with respect to Meckel’s cartilage and ethmoid plate in control and adamts2-knockdown zebrafish. (L) Comparison of the sox3 protein expression levels in control crispant and adamts2 crispant zebrafish at 72 hpf and 96 hpf. n = 3 independent replicates for all experiments. For (D–K): control crispant n = 56 embryos, adamts2 crispant n = 41 embryos. Error bar represents the SD. ns, no significance, *** p < 0.001. Scale bars: 500 μm (A), 100 μm (D–J). EXPRESSION / LABELING:
PHENOTYPE:
|
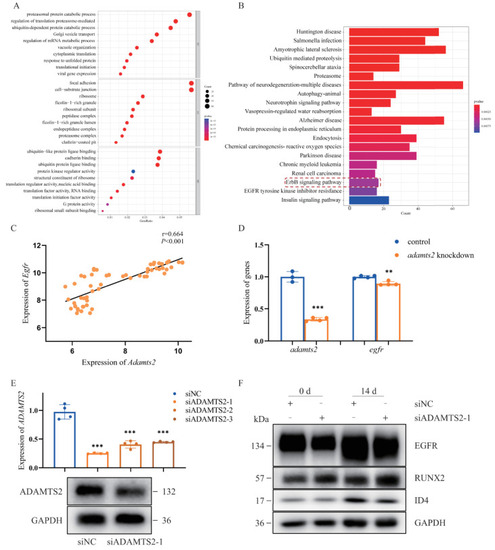
ADAMTS2 was involved in several important pathological pathways based on gene ontology (GO) and Kyoto Encyclopedia of Genes and Genomes (KEGG) enrichment analysis. (A) The top 10 GO terms by gene ratio in the biological process terms and cellular component terms and molecular function terms in the enrichment analysis. (B) The top 20 most significantly enriched pathways by p-value with the genes co-expressed with ADAMTS2 in the KEGG analysis. (C) Egfr was co-expressed with Adamts2 during mouse embryonic development of upper and lower jaw (E10.5–E14.5). (D) qRT-PCR analysis of the expression of egfr in the adamts2-knockdown zebrafish embryos at 72 hpf. (E) qRT-PCR and Western blot analysis of the ADAMTS2 knockdown efficiency in hMSCs. (F) Western blot analysis of the expression of pathway key genes and osteogenic indicators in hMSCs. Bars represent group means. ** p < 0.01, *** p < 0.001. n = 4 independent replicates for all experiments. EXPRESSION / LABELING:
PHENOTYPE:
|