
Fig. 2
- ID
- ZDB-FIG-220926-39
- Publication
- Yao et al., 2022 - Skeletal Class III Malocclusion Is Associated with ADAMTS2 Variants and Reduced Expression in a Familial Case
- Other Figures
- All Figure Page
- Back to All Figure Page
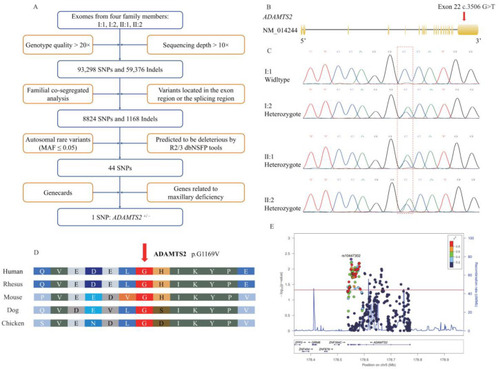
(A) Flow chart outlining selection of the causative variant. (B) Schematic diagram of the ADAMTS2 gene showing the localization of the variant identified in this pedigree. (C) Sanger sequencing validation of the heterozygous c.3506G>T variant in the ADAMTS2 gene shows individuals I:2, II:1, and II:2 are heterozygous and I:1 is wild type. Red dotted frame indicates the position of causative variants. (D) Conservation of each amino acid residue across species is shown. The red arrow indicates the mutated amino acid. Glycine at position 1169 is conserved. (E) Regional plot of the association between ADAMTS2 and maxillary deficiency by logistic regression analysis. x-axis is the physical position in Mb with arrows denoting genes and expressed sequence tags in the region, the left y-axis plots the –log (p-value), and the right y-axis plots the CEPH recombination rate. The red horizontal line represents p = 0.05. |