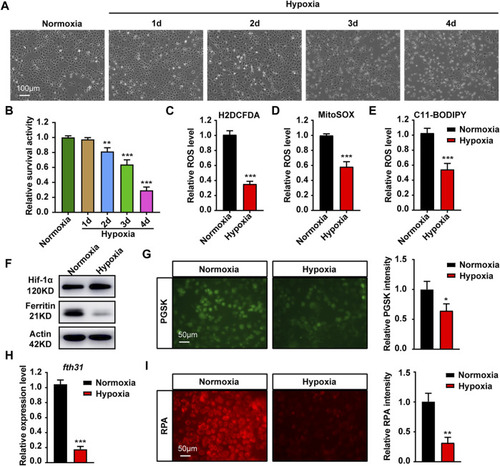
Hypoxia stress affects cell growth, ROS production and iron metabolism in cytoplasma and mitochondria. (A) Microscopic analysis of morphological changes of ZFL cells under normoxia or hypoxia for 1, 2, 3 and 4 d. (B) Cell Viability analyzed with PrestoBlue™ HS Cell Viability Regent under normoxia or hypoxia for 1, 2, 3 and 4 d. (C–E) Analysis of changes in total ROS (C), mitochondrial-derived ROS (D) and lipid peroxidation (E) levels in cells with CM-H2DCFDA, MitoSOX and C11-BODIPY probe under normoxia and hypoxia for 3 days. (F) Western blot analysis of Ferritin expression in ZFL cells cultured under normoxia and hypoxia for 3 days. (G) Phen Green™ SK (PGSK) probe analysis and quantification of cytoplasmic free iron content in ZFL cells after treated under normoxia and hypoxia for 3 days. (H) The mRNA expression of mitochondrial iron storage gene fth31 in ZFL cells quantified by real-time RT–PCR under normoxia and hypoxia for 3 days. (I) Fluorescence microscope with RPA red indicator analysis and quantification of mitochondrial iron content in ZFL cells treated under normoxia and hypoxia for 3 days. Normoxia was used as a control group for significance analysis. Error bars, mean ± s.d., n = 3 (biological replicates).

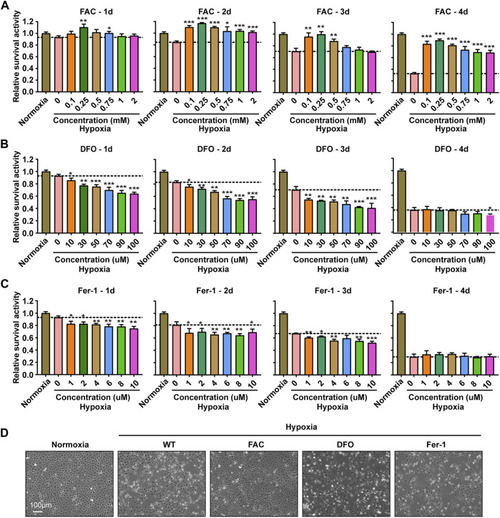
Iron supplementation could improve the survival activity of ZFL cells under hypoxia stress, but iron chelation and inhibition of ferroptosis could not. (A–C) Survival rate of ZFL cells analyzed with PrestoBlue™ HS Cell Viability Regent after treated with a series of concentrations of FAC (A), DFO (B) and Fer-1 (C) under hypoxic stress from one to 4 days. Hypoxia 0 mM or hypoxia 0 µM was used as a control group for significance analysis. (D) The microscope analysis of morphology changes of ZFL cells under normoxia or treated with FAC (2.5 mM), DFO (10 µM) and Fer-1 (2.5 µM) under hypoxic stress for 3 days. Error bars, mean ± s.d., n = 3 (biological replicates).

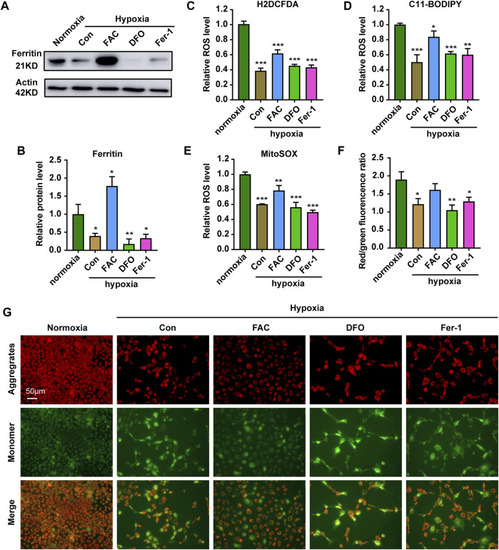
Iron supplementation can increase ROS level and reduce mitochondrial damage in cells under hypoxia stress. (A,B) Western blot analysis and quantification of Ferritin expression in ZFL cells cultured under normoxia and hypoxia treated with FAC, DFO and Fer-1 for 3 days. Actin as a loading control. (C–E) Analysis of changes in total ROS (C), lipid peroxidation level (D) and mitochondrial-derived ROS (E) levels in cells with H2DCFDA, C11-BODIPY and MitoSOX probe under normoxia and hypoxia for 3 days. Cells under hypoxic stress were rescued with FAC (2.5 mM), DFO (10 µM) and Fer-1 (2.5 µM). (F,G) Quantitative results and representative images of cellular JC-1 fluorescence in normoxic cell and hypoxic cells treated with FAC (2.5 mM), DFO (10 µM) and Fer-1 (2.5 µM) under hypoxia stress. Normoxia was used as a control group for significance analysis. Error bars, mean ± s.d., n = 3 (biological replicates).

RNA-seq analysis revealed significant transecriptomic changes in hypoxia ZFL cell. (A) Flow chart of sampl processing for RNA-seq. WT: ZFL cell. WT + FAC: ZFL cell treated with FAC. (B,C) Volcanic map analysis of gene expression. UP: up-regulated differentially expressed gene; DOWN: down-regulated differentially expressed gene; NOT: non-differentially expressed gene. (D,E) The enriched KEGG pathways identified from up-regulated DEGs of hypoxia (WT) cell and hypoxia (FAC) cell compared with normoxia (WT) cell. (F,G) GO enrichment test on the DEGs of hypoxia (WT) cell and hypoxia (FAC) cell compared with normoxia (WT) cell.

Iron supplementation increases the proportion of functioning mitochondria. (A,B) Western blot analysis and quantitative results of LC3 expression in ZFL cells cultured under normoxia and hypoxia treated with or without FAC (2.5 mM), DFO (10 µM) and Fer-1 (2.5 µM) for 3 days. Actin as a loading control. (C,D) Western blot analysis and quantitative results of P62 expression in ZFL cells cultured under normoxia and hypoxia treated with or without FAC (2.5 mM), DFO (10 µM) and Fer-1 (2.5 µM) for 3 days. Actin as a loading control. (E) Representative images and quantitative results of Mitotraker red Dye to visualize mitochondrial mass in normoxia cell and cell treated with or without FAC (2.5 mM), DFO (10 µM) and Fer-1 (2.5 µM) under hypoxia stress for 3 days. (F) Representative images and quantitative results of Lysotraker red DND-99 Dye to visualize acid lysosomal in normoxia cell and cell treated with or without FAC (2.5 mM), DFO (10 µM) and Fer-1 (2.5 µM) under hypoxia stress for 3 days. Normoxia was used as a control group for significance analysis. Error bars, mean ± s.d., n = 3 (biological replicates).

Response of ZF4 cells to hypoxic stress. (A) Cell Viability was analyzed with PrestoBlue™ HS Cell Viability Regent under normoxia or hypoxia treated for 1, 2, 3 and 4 d. (B) The mRNA expression of iron absorption and storage gene in ZFL cells was quantified by real-time RT–PCR under normoxia and hypoxia for 3 days. (C) Western blot analysis of Hif-1α and Ferritin expression in ZF4 cells cultured under normoxia and hypoxia for 3 days. (D) The microscope analysis of morphology changes in ZF4 cells under normoxia or hypoxia treated with or without FAC (2.5 mM), DFO (10 µM) and Fer-1 (2.5 µM) for 3 days. (E) Cell Viability was analyzed with PrestoBlue™ HS Cell Viability Regent under normoxia or hypoxia treated with or without FAC (2.5 mM), DFO (10 µM) and Fer-1 (2.5 µM). (F–H) Analysis of changes in general ROS (F), mitochondrial-derived ROS (G) and lipid peroxidation (H) levels in cells with H2DCFDA, MitoSOX and C11-BODIPY probe under normoxia and hypoxia for 3 days. Cells under hypoxic stress were rescued with FAC (2.5 mM), DFO (10 µM) and Fer-1 (2.5 µM). Normoxia was used as a control group for significance analysis. Error bars, mean ± s.d., n = 3 (biological replicates).

Acknowledgments
This image is the copyrighted work of the attributed author or publisher, and ZFIN has permission only to display this image to its users. Additional permissions should be obtained from the applicable author or publisher of the image. Full text @ Front. Physiol.