IMAGE

FIGURE 6

ID
ZDB-IMAGE-220914-56
Source
Figures for Hu et al., 2022
Image
Figure Caption

FIGURE 6

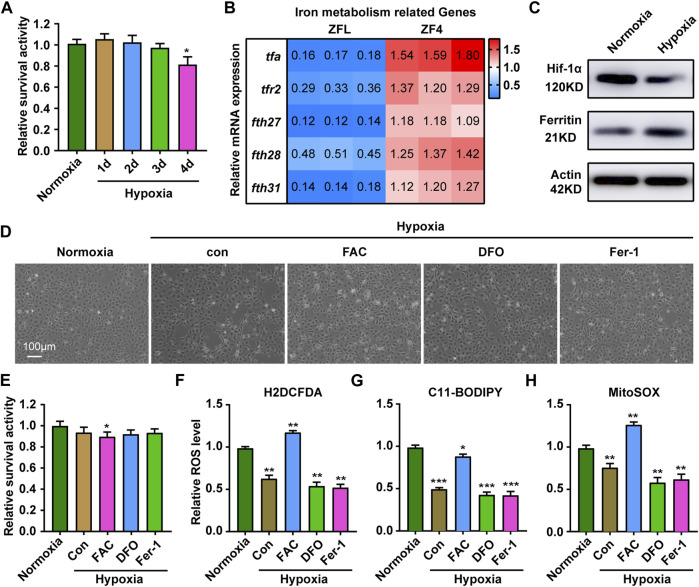
Response of ZF4 cells to hypoxic stress. (A) Cell Viability was analyzed with PrestoBlue™ HS Cell Viability Regent under normoxia or hypoxia treated for 1, 2, 3 and 4 d. (B) The mRNA expression of iron absorption and storage gene in ZFL cells was quantified by real-time RT–PCR under normoxia and hypoxia for 3 days. (C) Western blot analysis of Hif-1α and Ferritin expression in ZF4 cells cultured under normoxia and hypoxia for 3 days. (D) The microscope analysis of morphology changes in ZF4 cells under normoxia or hypoxia treated with or without FAC (2.5 mM), DFO (10 µM) and Fer-1 (2.5 µM) for 3 days. (E) Cell Viability was analyzed with PrestoBlue™ HS Cell Viability Regent under normoxia or hypoxia treated with or without FAC (2.5 mM), DFO (10 µM) and Fer-1 (2.5 µM). (F–H) Analysis of changes in general ROS (F), mitochondrial-derived ROS (G) and lipid peroxidation (H) levels in cells with H2DCFDA, MitoSOX and C11-BODIPY probe under normoxia and hypoxia for 3 days. Cells under hypoxic stress were rescued with FAC (2.5 mM), DFO (10 µM) and Fer-1 (2.5 µM). Normoxia was used as a control group for significance analysis. Error bars, mean ± s.d., n = 3 (biological replicates).

Acknowledgments
This image is the copyrighted work of the attributed author or publisher, and ZFIN has permission only to display this image to its users. Additional permissions should be obtained from the applicable author or publisher of the image. Full text @ Front. Physiol.