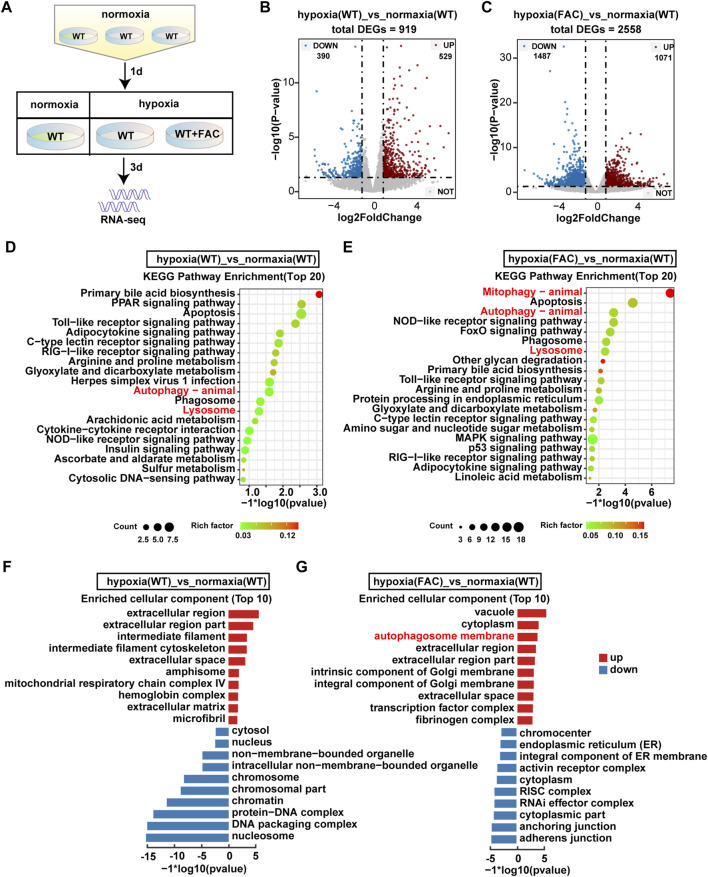
RNA-seq analysis revealed significant transecriptomic changes in hypoxia ZFL cell. (A) Flow chart of sampl processing for RNA-seq. WT: ZFL cell. WT + FAC: ZFL cell treated with FAC. (B,C) Volcanic map analysis of gene expression. UP: up-regulated differentially expressed gene; DOWN: down-regulated differentially expressed gene; NOT: non-differentially expressed gene. (D,E) The enriched KEGG pathways identified from up-regulated DEGs of hypoxia (WT) cell and hypoxia (FAC) cell compared with normoxia (WT) cell. (F,G) GO enrichment test on the DEGs of hypoxia (WT) cell and hypoxia (FAC) cell compared with normoxia (WT) cell.
Acknowledgments
This image is the copyrighted work of the attributed author or publisher, and
ZFIN has permission only to display this image to its users.
Additional permissions should be obtained from the applicable author or publisher of the image.
Full text @ Front. Physiol.
Your Input Welcome
Thank you for submitting comments. Your input has been emailed to ZFIN curators who may contact you if
additional information is required.
Oops. Something went wrong. Please try again later.