
- Title
-
Concentration-response gene expression analysis in zebrafish reveals phenotypically-anchored transcriptional responses to retene
- Authors
- Wilson, L.B., McClure, R.S., Waters, K.M., Simonich, M.T., Tanguay, R.L.
- Source
- Full text @ Front Toxicol
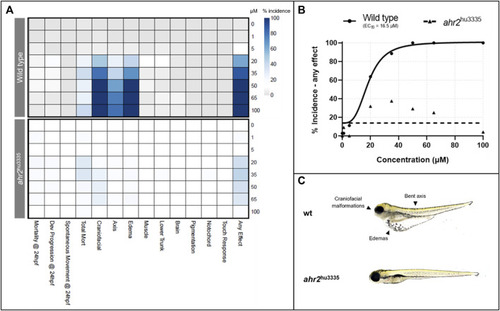
Effects of retene exposure on zebrafish development at 24 and 120 hpf in wild type and AHR2 mutant fish. |
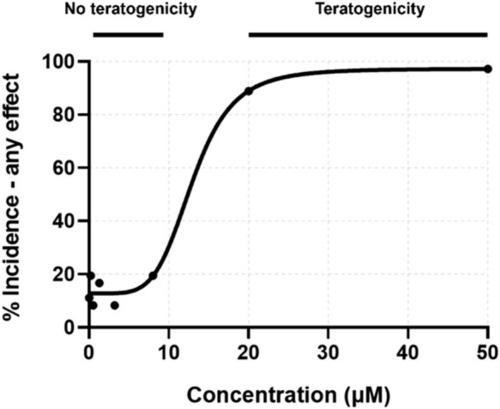
Concentration-response curve for percent incidence of any teratogenic effect observed at 24 or 120 hpf. Exposure concentrations for toxicity screening were matched to those for transcriptomic assessment. |
|
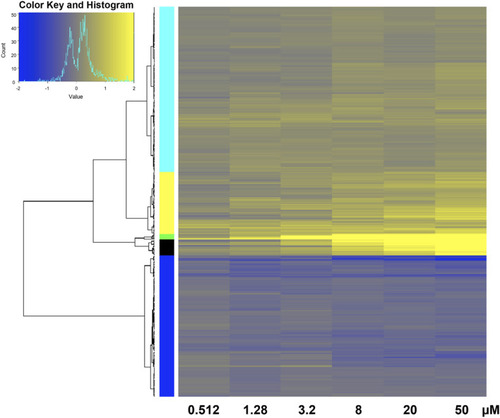
Heatmap of transcriptomic response at each retene concentration for genes common to both non-teratogenic and teratogenic concentrations. Average Log2FC values for each gene at each treatment are displayed with yellow indicating higher expression and blue indicating lower expression compared to DMSO vehicle control. Genes are grouped by ward clustering with gene clusters on the left. |
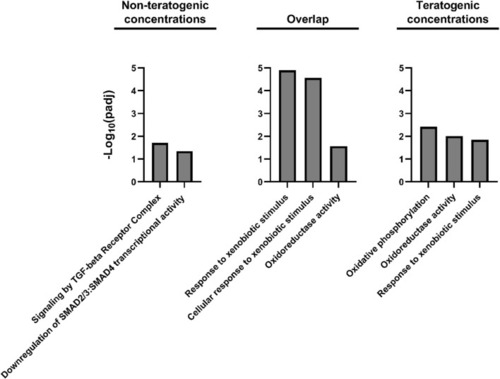
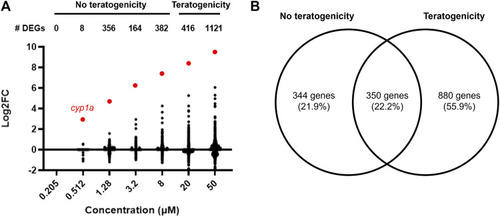
Gene Ontology and Reactome pathway enrichment for DEGs unique to non-teratogenic concentrations, DEGs overlapping at least one non-teratogenic and one teratogenic concentration, and DEGs unique to teratogenic concentrations. |
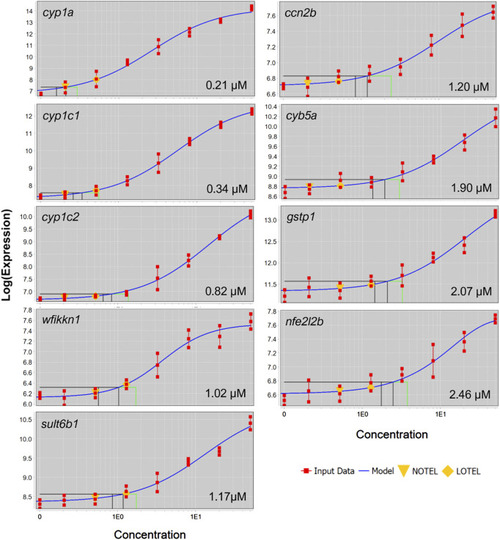
Concentration-response curves for black and green cluster genes which were differentially expressed in at four concentrations. Gene symbol and BMC are displayed in each panel. |
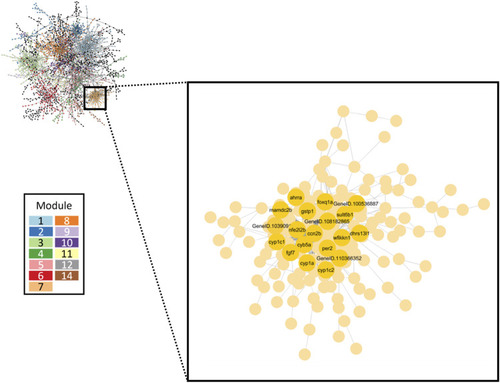
Gene co-expression network inferred from all retene concentrations. The largest 13 modules are differentiated by color. The inset box highlights Module seven which contained the greatest number of high responding genes. Black and green cluster genes which showed the strongest change in expression in response to increasing retene concentration are denoted. |