
Image
|
Figure Caption
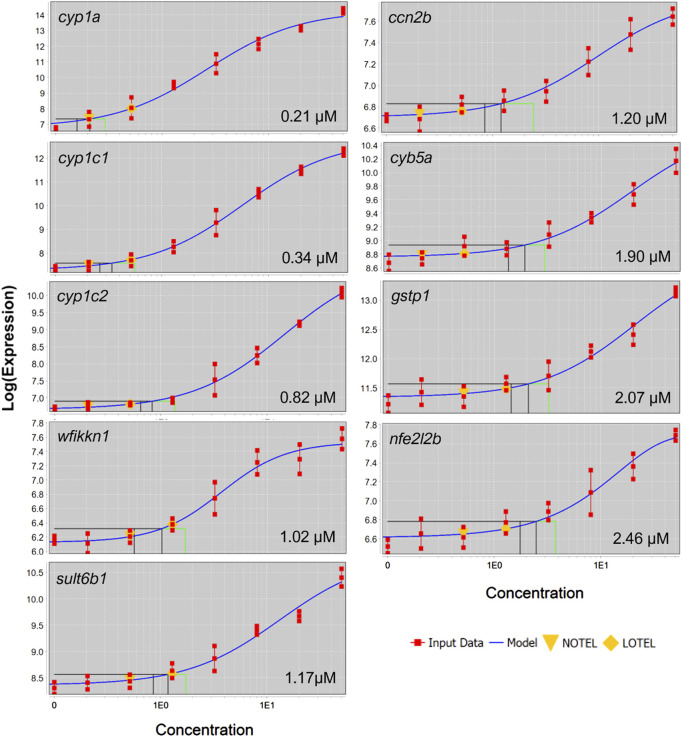
FIGURE 6
Concentration-response curves for black and green cluster genes which were differentially expressed in at four concentrations. Gene symbol and BMC are displayed in each panel.
Acknowledgments
This image is the copyrighted work of the attributed author or publisher, and
ZFIN has permission only to display this image to its users.
Additional permissions should be obtained from the applicable author or publisher of the image.
Full text @ Front Toxicol