
Image
|
Figure Caption
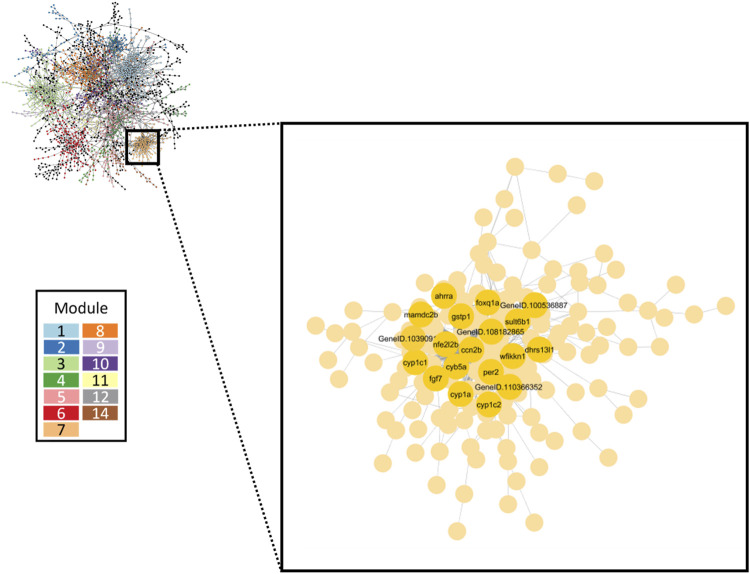
FIGURE 7
Gene co-expression network inferred from all retene concentrations. The largest 13 modules are differentiated by color. The inset box highlights Module seven which contained the greatest number of high responding genes. Black and green cluster genes which showed the strongest change in expression in response to increasing retene concentration are denoted.
Acknowledgments
This image is the copyrighted work of the attributed author or publisher, and
ZFIN has permission only to display this image to its users.
Additional permissions should be obtained from the applicable author or publisher of the image.
Full text @ Front Toxicol