
Image
|
Figure Caption
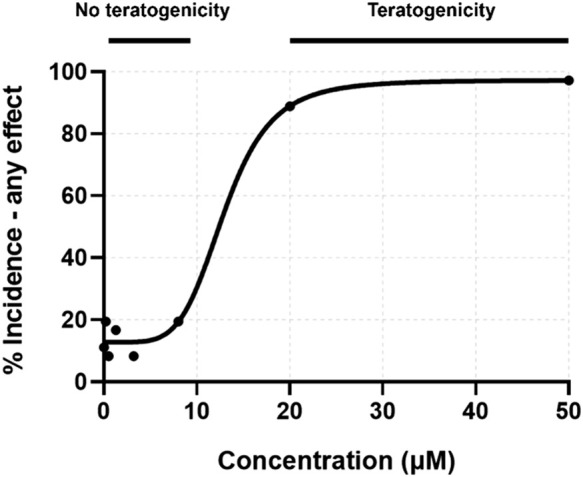
FIGURE 2
Concentration-response curve for percent incidence of any teratogenic effect observed at 24 or 120 hpf. Exposure concentrations for toxicity screening were matched to those for transcriptomic assessment.
Acknowledgments
This image is the copyrighted work of the attributed author or publisher, and
ZFIN has permission only to display this image to its users.
Additional permissions should be obtained from the applicable author or publisher of the image.
Full text @ Front Toxicol