
FIGURE
FIGURE 4
- ID
- ZDB-FIG-220914-46
- Publication
- Wilson et al., 2022 - Concentration-response gene expression analysis in zebrafish reveals phenotypically-anchored transcriptional responses to retene
- Other Figures
- All Figure Page
- Back to All Figure Page
FIGURE 4
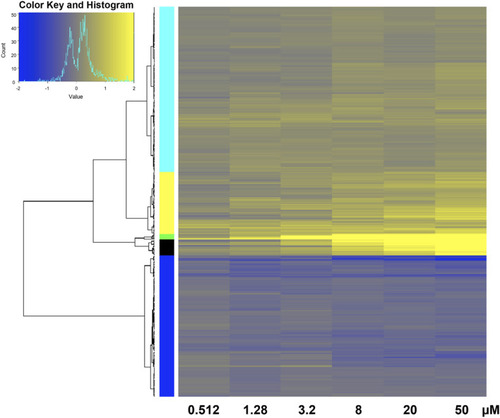
Heatmap of transcriptomic response at each retene concentration for genes common to both non-teratogenic and teratogenic concentrations. Average Log2FC values for each gene at each treatment are displayed with yellow indicating higher expression and blue indicating lower expression compared to DMSO vehicle control. Genes are grouped by ward clustering with gene clusters on the left. |
Expression Data
Expression Detail
Antibody Labeling
Phenotype Data
Phenotype Detail
Acknowledgments
This image is the copyrighted work of the attributed author or publisher, and
ZFIN has permission only to display this image to its users.
Additional permissions should be obtained from the applicable author or publisher of the image.
Full text @ Front Toxicol