
Image
|
Figure Caption
FIGURE 1
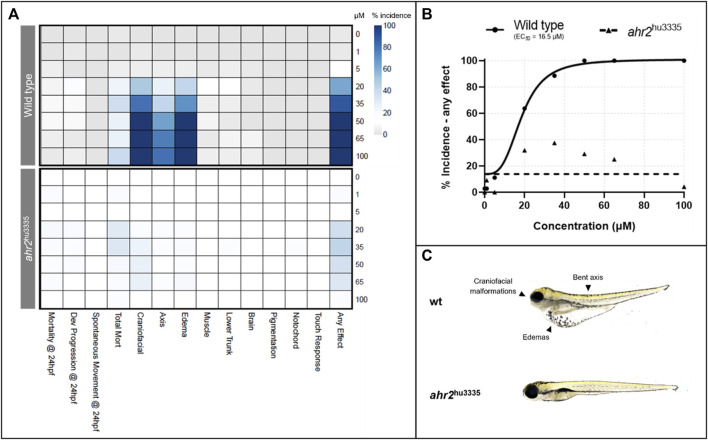
Effects of retene exposure on zebrafish development at 24 and 120 hpf in wild type and AHR2 mutant fish.
Acknowledgments
This image is the copyrighted work of the attributed author or publisher, and
ZFIN has permission only to display this image to its users.
Additional permissions should be obtained from the applicable author or publisher of the image.
Full text @ Front Toxicol