
- Title
-
eif4ebp3l-A New Affector of Zebrafish Angiogenesis and Heart Regeneration?
- Authors
- Born, L.I., Andree, T., Frank, S., Hübner, J., Link, S., Langheine, M., Charlet, A., Esser, J.S., Brehm, R., Moser, M.
- Source
- Full text @ Int. J. Mol. Sci.
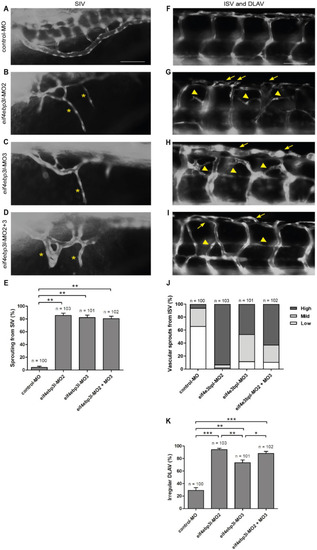
Loss of eukaryotic initiation factor 4E binding protein 3 like (eif4ebp3l) induced sprouting angiogenesis during zebrafish vascular development. (A–I) Lateral view of morpholino-injected Tg(fli1:eGFP) zebrafish at 94 h post fertilization (hpf). Anterior is to the left, abdominal (A–D) or trunk (F–I) regions are shown. Embryos were injected at 1–2 cell stage with control-MO (A), eif4ebp3l-morpholino 2 (MO2), eif4ebp3l-morpholino 3 (MO3) or a combination of the two. (B–D) In eif4ebp3l morphants the sub intestinal vein (SIV) was irregular and formed ventral additional vascular sprouts (yellow starlets). (E) Quantification of the formation of additional vascular sprouts from the SIV. (F–I) Eif4ebp3l morphants displayed vascular sprouting from the intersegmental vessels (ISVs) and within the dorsal longitudinal anastonomic vessel (DLAV). The additional sprouts formed cross links between neighboring ISVs (yellow arrowheads) and led to an increase of width in the DLAV (yellow arrows). (J) Quantification of the number of vascular sprouts of the ISV. Embryos were grouped in low phenotypes (one to two sprouts per ISV), mild (three to four sprouts per ISV) or high phenotypes (>five sprouts per ISV). (K) Quantification of Tg(fli1:eGFP) embryos with irregular DLAV. Comparison between the groups was made by using the Fisher‘s Exact test. p-value adjustments for multiple testing were performed by using the Bonferroni-Holm correction method. Values are mean ± SEM. * refers to p < 0.05, ** to p < 0.005 and *** to p < 0.0005. Scale bar = 50 µm. EXPRESSION / LABELING:
PHENOTYPE:
|
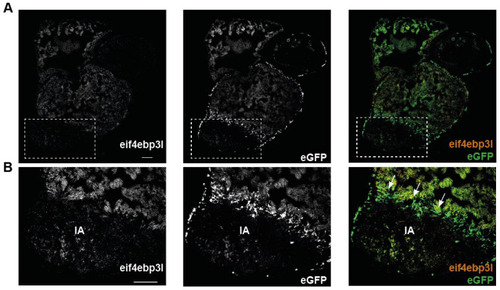
At day three after cryoinjury eif4ebp3l is downregulated in the injured area (IA). (A,B) Images of RNAscope in situ hybridizations (ISH) for eif4ebp3l (left panels, orange in the right panel) and eGFP (middle panels, green in the left panel) on cryosections of Tg(fli1:eGFP) zebrafish heart three days post cryoinjury (dpci). (A) Overview of the whole zebrafish heart; the IA is outlined with the dotted box. Eif4ebp3l was highly expressed in the healthy myocardium and downregulated in the IA. (B) Higher magnifications of the IA. eGFP was highly expressed in the border zone, where the formation of new endothelial vessels originated. Eif4ebp3l was co-located to these eGFP-positive endothelial cells in the border zone (white arrows), whereas in the center of the injured area its mRNA expression was strongly downregulated. Scale bar = 100 µm. |
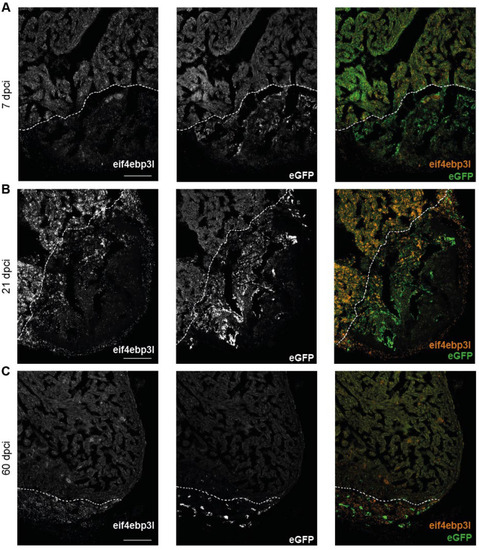
In the injured area the mRNA expression of eif4ebp3l decreased in the early phase of zebrafish heart regeneration. (A–C) RNAscope of the apex of Tg(fli1:eGFP) zebrafish heart at 7 dpci, 21 dpci and 60 dpci. In the merged image mRNA expression of eGFP is visualized in green and eif4ebp3l in orange. Dashed lines highlight the approximate border to the IA. (A) Eif4ebp3l was highly expressed in the healthy myocardium and downregulated in IA. (B,C) With progressive regeneration of the zebrafish heart, the expression of eif4ebp3l recovered in the IA and reached the mRNA expression level of the healthy myocardium at 60 dpci. Scale bar = 100 µm. |

Heat-shock inducible overexpression of eif4ebp3l. (A) Schematic diagram of eif4ebp3l transgene and its cloning strategy used to achieve the heat-shock inducible overexpression of eif4ebp3l. (B) Embryo of the transgenic zebrafish strain Tg(fli1:eGFP/hsp70l:eif4ebp3l-p2A-tdTomato) 42 h after heat-shock. (C,D) Caudal fin and heart of an adult Tg(fli1:eGFP/hsp70l:eif4ebp3l-p2A-tdTomato) zebrafish 44 h and 24 h after heat-shock treatment. (E) Quantification of eif4ebp3l mRNA expression of Tg(fli1:eGFP/hsp70l:eif4ebp3l-p2A-tdTomato) zebrafish embryos and their wild-type siblings after heat-shock treatment by qRT-PCR. Embryos were heat-shocked at 30 hpf. Values are mean ± SEM and ** refers to p < 0.005. n = 300 per group. Scale bar = 500 µm. EXPRESSION / LABELING:
PHENOTYPE:
|
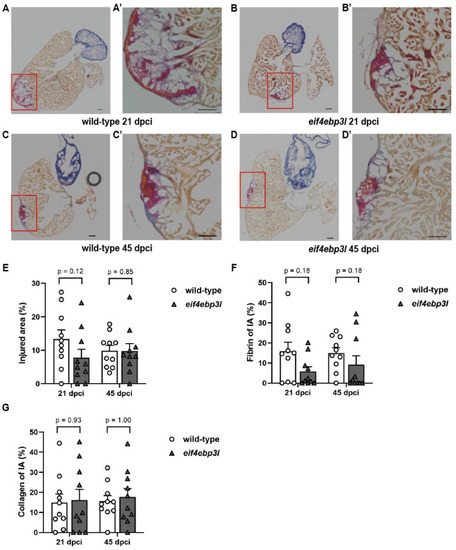
Effects of eif4ebp3l overexpression on scar formation after cryoinjury. (A–D’) Acid fuchsin orange G (AFOG) staining of wild-type Tg(fli1:eGFP) and Tg(fli1:eGFP/hsp70l:eif4ebp3l-p2A-tdTomato) zebrafish hearts at 21 dpci and 45 dpci. Intact myocardium is stained in orange, fibrin in red and collagen in blue. The injured area (IA) is marked by the red box. (A’–D’) Magnified view of the IA. (E–G) Quantification of the IA and its composition. Values are mean ± SEM, n = 10 per group and day post cryoinjury. Scale bar = 100 µm. PHENOTYPE:
|
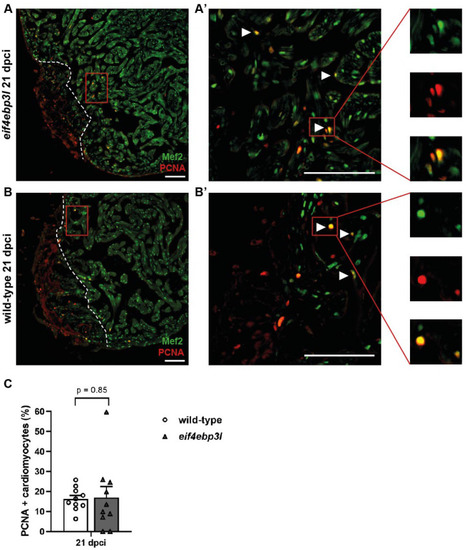
Comparison of cardiomyocyte (CM) proliferation of Tg(fli1:eGFP/hsp70l:eif4ebp3l-p2A-tdTomato) and wild-type siblings at 21 dpci. (A–B’) Representative immunofluorescence images of cardiac tissue of wild-type and Tg(fli1:eGFP/hsp70l:eif4ebp3l-p2A-tdTomato) at 21 dpci. Mef2 marks CM nuclei in green and PCNA nuclei of proliferating cells in red. PCNA–positive CMs are indicated with white arrowheads, and insets are magnified views of the marked cells. Dashed lines highlight the approximate border of the injured area. (C) Quantification of proliferating CMs expressing PCNA within 150 µm from the injury border. Values are mean ± SEM, n = 10 per group. Scale bar = 100 µm. |