
|
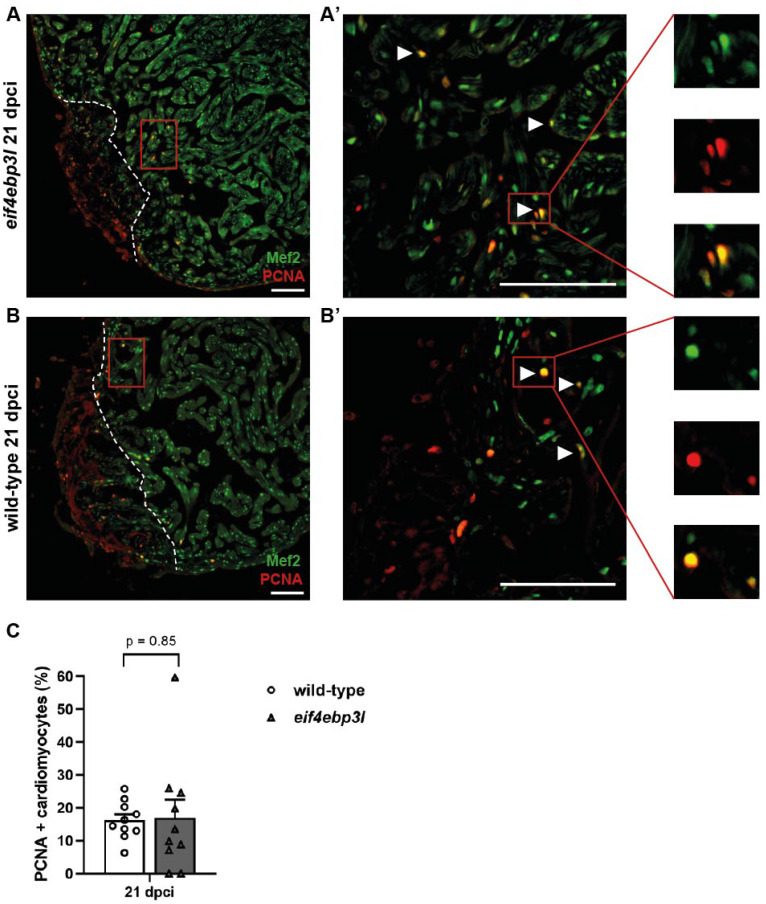
Fig. 6
Comparison of cardiomyocyte (CM) proliferation of Tg(fli1:eGFP/hsp70l:eif4ebp3l-p2A-tdTomato) and wild-type siblings at 21 dpci. (A–B’) Representative immunofluorescence images of cardiac tissue of wild-type and Tg(fli1:eGFP/hsp70l:eif4ebp3l-p2A-tdTomato) at 21 dpci. Mef2 marks CM nuclei in green and PCNA nuclei of proliferating cells in red. PCNA–positive CMs are indicated with white arrowheads, and insets are magnified views of the marked cells. Dashed lines highlight the approximate border of the injured area. (C) Quantification of proliferating CMs expressing PCNA within 150 µm from the injury border. Values are mean ± SEM, n = 10 per group. Scale bar = 100 µm.