
- Title
-
The Expression and Function of lincRNA-154324 and the Adjoining Protein-Coding Gene vmp1 in the Caudal Fin Regeneration of Zebrafish
- Authors
- Li, J., Wen, W., Zhang, S., Zhou, C., Feng, Y., Li, X.
- Source
- Full text @ Int. J. Mol. Sci.
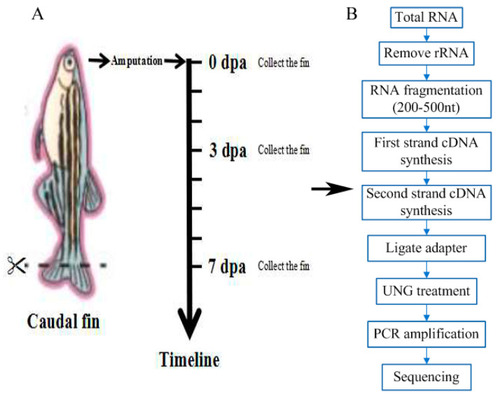
Schematic diagram of the experimental process. (A) Schematic diagram of the time points of the zebrafish caudal fin sampling. (B) Schematic diagram of the experimental process. CK0dpa, control group at 0 days post-amputation; T3dpa and T7dpa, caudal fin regeneration at 3 and 7 days post-amputation, respectively. |
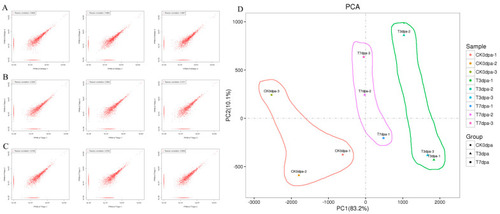
Quality analysis on the transcriptome sequencing. (A–C) The correlation coefficients of the paired repeatability test. The closer the correlation between two parallel experiments of the same sample was to 1, the higher the repeatability. CK0dpa, control group at 0 days post-amputation; T3dpa and T7dpa, caudal fin regeneration at 3 and 7 days post-amputation, respectively. (D) The principal component analysis (PCA) for each sample. CK0dpa, control group at 0 days post-amputation; T3dpa and T7dpa, caudal fin regeneration at 3 and 7 days post-amputation, respectively. |
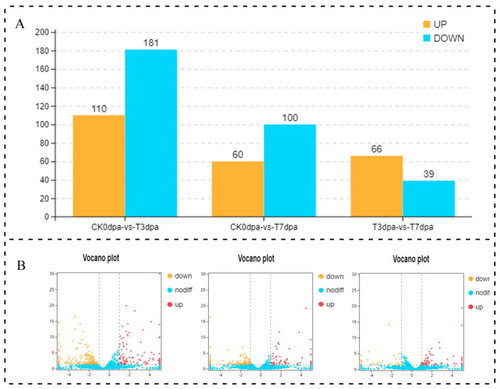
The statistical analysis on the DE lncRNAs at the different stages of caudal fin regeneration. (A) The numbers of up-regulated and down-regulated lncRNAs at different regeneration stages are showed in a bar graph. (B) The numbers of up-regulated and down-regulated lncRNAs at different regeneration stages are showed in volcano plots. The abscissa represents the logarithmic value of the difference multiple of two samples (CK0dpa vs. T3dpa, CK0dpa vs. T7dpa, T3dpa vs. T7dpa), and the ordinate represents the negative log10 value of the FDR of the two samples. The red (sample−2 expression is up-regulated relative to sample−1) and yellow (the expression level is down-regulated) colors indicate that there is a difference in gene expression (judgment criterion was FDR < 0.05, and the difference multiple was more than 2), and the black color indicates no difference. CK0dpa, control group at 0 days post-amputation; T3dpa and T7dpa, caudal fin regeneration at 3 and 7 days post-amputation, respectively. |
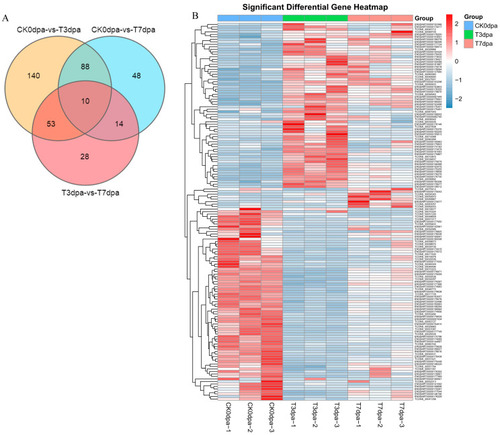
The statistical analysis on the DE lncRNAs at different stages of caudal fin regeneration. (A) Venn diagram showing the DE lncRNAs at three stages of caudal fin regeneration. (B) Heat map showing the DE lncRNA expression levels during caudal fin regeneration at 0 dpa, 3 dpa, and 7 dpa. CK0dpa, control group at 0 days post-amputation; T3dpa and T7dpa, caudal fin regeneration at 3 and 7 days post-amputation respectively. |
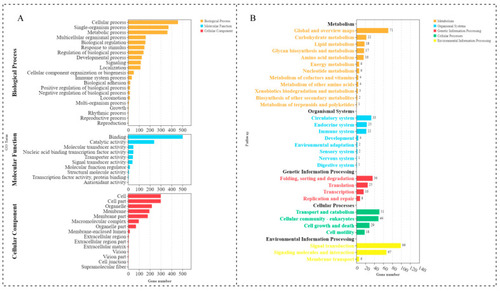
GO and KEGG enrichment analyses for the DE lncRNA cis-targeted genes. (A) Histogram of significant GO enrichment in DE lncRNAs. Yellow represents biological processes, red represents cellular components, and blue represents molecular functions. (B) KEGG pathway enrichment in DE lncRNAs. |
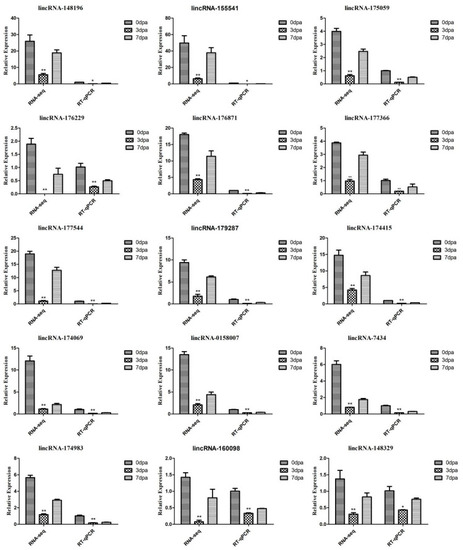
Verification of the differentially expressed lncRNAs with RT-qPCR: the relative expression of lncRNAs in caudal fin regeneration. Data (mean ± SEM) are representative results derived from three independent experiments. (**) p < 0.01, (*) p < 0.05, when comparing to 0 dpa. |
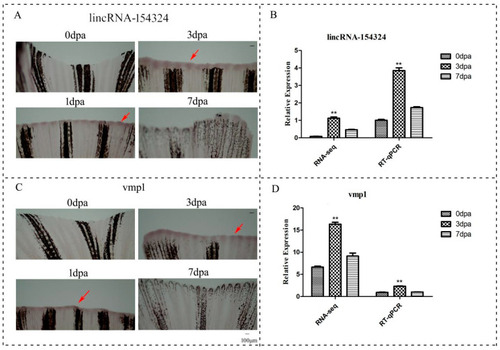
The temporal and spatial expression of lincRNA-154324 and vmp1 in caudal fin regeneration. (A) 0 dpa–7 dpa: lincRNA-154324 spatial expression in zebrafish caudal fin for different processes of regeneration, as shown using WISH. Red arrow: pointing to the positive site. Scale bars: 100 μm. (B) The relative expression of lincRNA-154324 in caudal fin regeneration, as shown using RT-qPCR and RNA-seq. Data (mean ± SEM) are representative results derived from three independent experiments. (**) p< 0.01, when comparing to 0 dpa. (C) 0 dpa–7 dpa: vmp1 spatial expression in zebrafish caudal fin regeneration, as shown using WISH. Red arrow: pointing to the positive site. Scale bars: 100 μm. (D) The relative expression of vmp1 in caudal fin regeneration, as shown using RT-qPCR and RNA-seq. Data (mean ± SEM) are representative results derived from three independent experiments. (**) p < 0.01, when comparing to 0 dpa. |
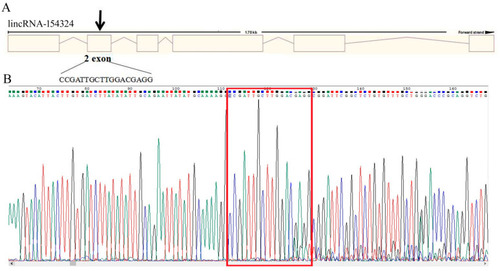
The sequence detection results for lincRNA-154324 knockout. (A) Gene architecture of lincRNA-154324 showing the target site of the SgRNA. (B) The sequence detection results for lincRNA-154324 knockout for embryos at 24 hpf. The red box indicates the knockout target site area. |
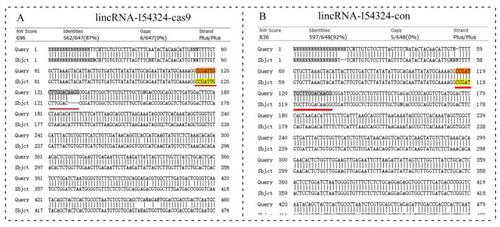
The sequence detection results for lincRNA-154324 knockout. (A) Alignment of caudal fin sequences from the control and the lincRNA-154324-cas9-knockout F0-generation adult zebrafish. (B) Alignment of caudal fin sequences from the control and the lincRNA-154324-con F0-generation adult zebrafish. Highlight, red line and red box: indicates the knockout target site area. |
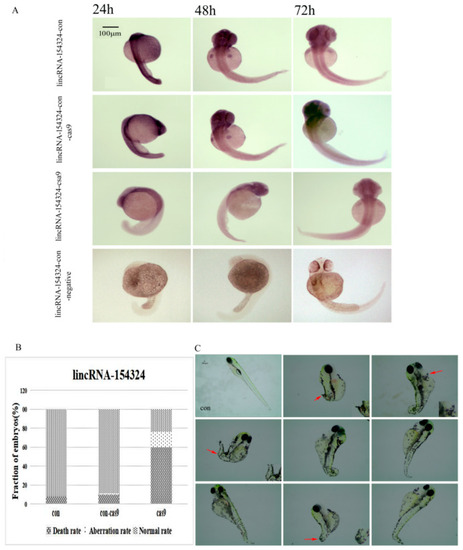
The expression and morphology of the lincRNA-154324 knockout larvae. (A) LincRNA-154324 spatial expression in the lincRNA-154324-con, lincRNA-154324-con-cas9 (a control group in which only cas9 was injected), lincRNA-154324-cas9, and lincRNA-154324-con-negative (a negative control group for WISH) groups at different stages of zebrafish embryogenesis. Scale bars: 100 μm. (B) Frequency of CRISPR/Cas9-micro-injection phenotypes in injected embryos. (C) The morphological results after lincRNA-154324 gene knockout at 7 dpf. con: control group. Red arrow: pointing to the deformed part. Scale bars: 100 μm. |
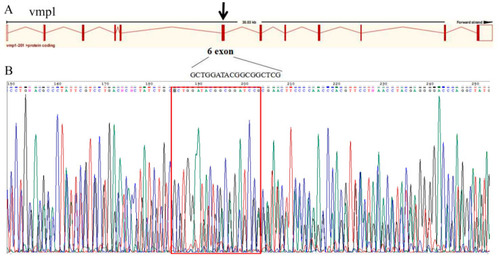
The sequence detection results for vmp1 knockout. (A) Gene architecture of vmp1, showing the target site of the SgRNA. (B) The sequence detection results for vmp1 knockout for 24 hpf embryos. The red box indicates the knockout target site area. |
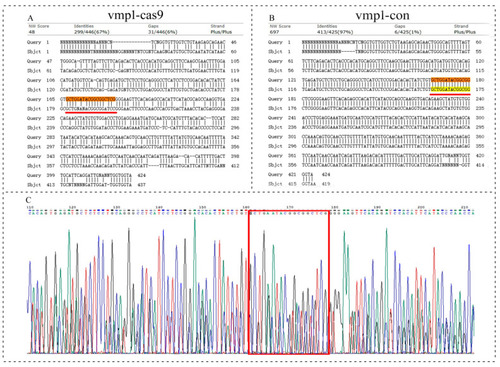
The sequence detection results for vmp1 knockout. (A) Alignment of caudal fin sequences from the control and the vmp1-cas9-knockout F0-generation adult zebrafish. (B) Alignment of caudal fin sequences from the control and the vmp1-con F0-generation adult zebrafish. (C) Sequencing of the 24 hpf embryos from the vmp1-cas9-knockout F1-generation fish. Highlight red line and red box: indicates the knockout target site area. |
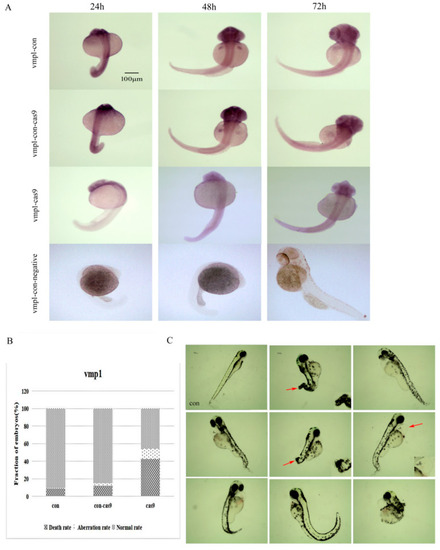
The expression and morphology of the vmp1 knockout larvae. (A) Vmp1 spatial expression in the vmp1-con, vmp1-con-cas9 (a control group in which only cas9 was injected), vmp1-cas9, and vmp1-con-negative (a negative control group for WISH) groups at different stages of zebrafish embryogenesis. Scale bars: 100 μm. (B) Frequency of CRISPR/Cas9-micro-injection phenotypes in injected embryos. (C) The morphological results after vmp1 gene knockout at 7 dpf. con: control group. dpf: days post-fertilization. Red arrow: pointing to the deformed part. Scale bars: 100 μm. |
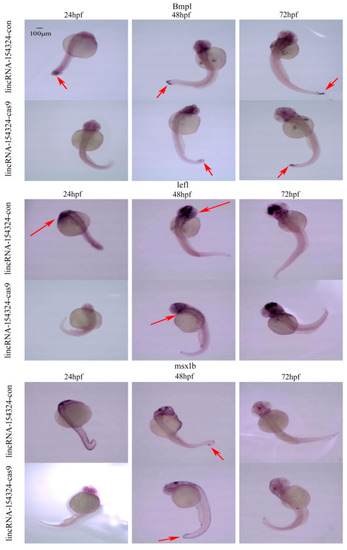
The temporal and spatial expression of marker genes related to caudal fin regeneration in 24–72 hpf embryos after lincRNA-154324 gene knockout. Bmp1a, lef1, and msx1b spatial expression in the lincRNA-154324-con and lincRNA-154324-cas9 groups at different stages of zebrafish embryogenesis. Red arrows: pointing to the site of gene expression. Scale bars: 100 μm. |
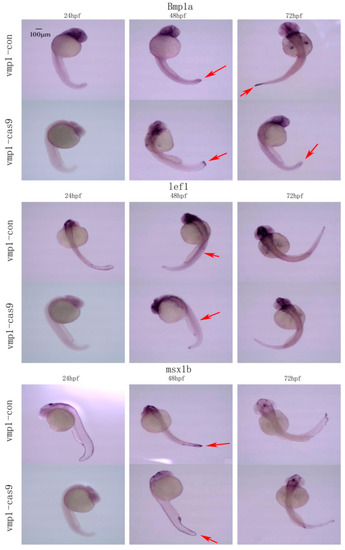
The temporal and spatial expression of marker genes related to caudal fin regeneration in 24–72 hpf embryos following vmp1 gene knockout. Bmp1a, lef1, and msx1b spatial expression in the vmp1-con and vmp1-cas9 groups at different stages of zebrafish embryogenesis. Red arrows: pointing to the site of gene expression. Scale bars: 100 μm. |