
Image
|
Figure Caption
Fig. 13
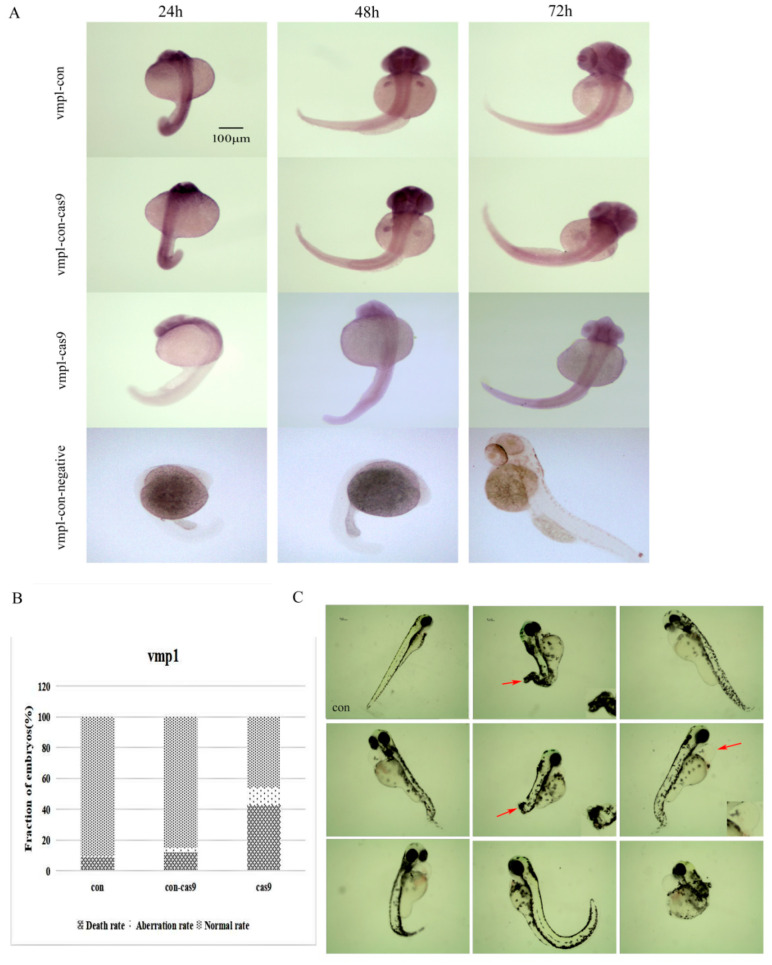
The expression and morphology of the vmp1 knockout larvae. (A) Vmp1 spatial expression in the vmp1-con, vmp1-con-cas9 (a control group in which only cas9 was injected), vmp1-cas9, and vmp1-con-negative (a negative control group for WISH) groups at different stages of zebrafish embryogenesis. Scale bars: 100 μm. (B) Frequency of CRISPR/Cas9-micro-injection phenotypes in injected embryos. (C) The morphological results after vmp1 gene knockout at 7 dpf. con: control group. dpf: days post-fertilization. Red arrow: pointing to the deformed part. Scale bars: 100 μm.
Acknowledgments
This image is the copyrighted work of the attributed author or publisher, and
ZFIN has permission only to display this image to its users.
Additional permissions should be obtained from the applicable author or publisher of the image.
Full text @ Int. J. Mol. Sci.