
Image
|
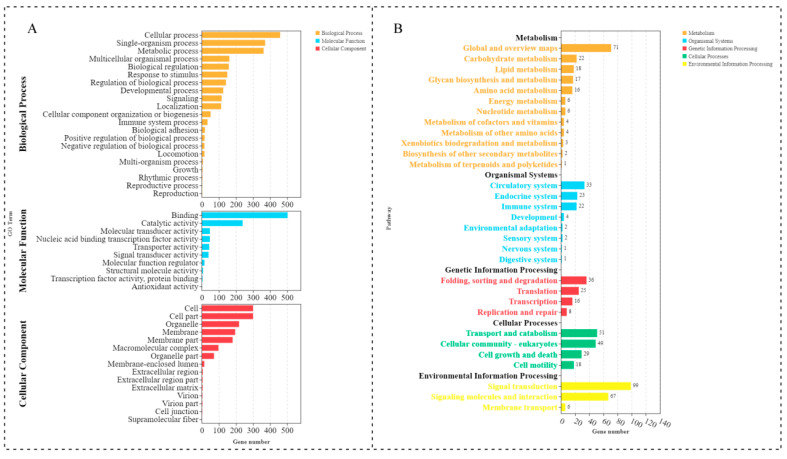
Figure Caption
Fig. 5
GO and KEGG enrichment analyses for the DE lncRNA cis-targeted genes. (A) Histogram of significant GO enrichment in DE lncRNAs. Yellow represents biological processes, red represents cellular components, and blue represents molecular functions. (B) KEGG pathway enrichment in DE lncRNAs.
Acknowledgments
This image is the copyrighted work of the attributed author or publisher, and
ZFIN has permission only to display this image to its users.
Additional permissions should be obtained from the applicable author or publisher of the image.
Full text @ Int. J. Mol. Sci.