
Image
|
Figure Caption
Fig. 2
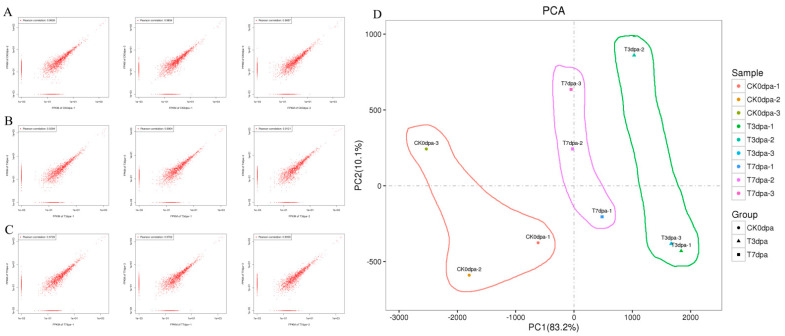
Quality analysis on the transcriptome sequencing. (A–C) The correlation coefficients of the paired repeatability test. The closer the correlation between two parallel experiments of the same sample was to 1, the higher the repeatability. CK0dpa, control group at 0 days post-amputation; T3dpa and T7dpa, caudal fin regeneration at 3 and 7 days post-amputation, respectively. (D) The principal component analysis (PCA) for each sample. CK0dpa, control group at 0 days post-amputation; T3dpa and T7dpa, caudal fin regeneration at 3 and 7 days post-amputation, respectively.
Acknowledgments
This image is the copyrighted work of the attributed author or publisher, and
ZFIN has permission only to display this image to its users.
Additional permissions should be obtained from the applicable author or publisher of the image.
Full text @ Int. J. Mol. Sci.