
Image
|
Figure Caption
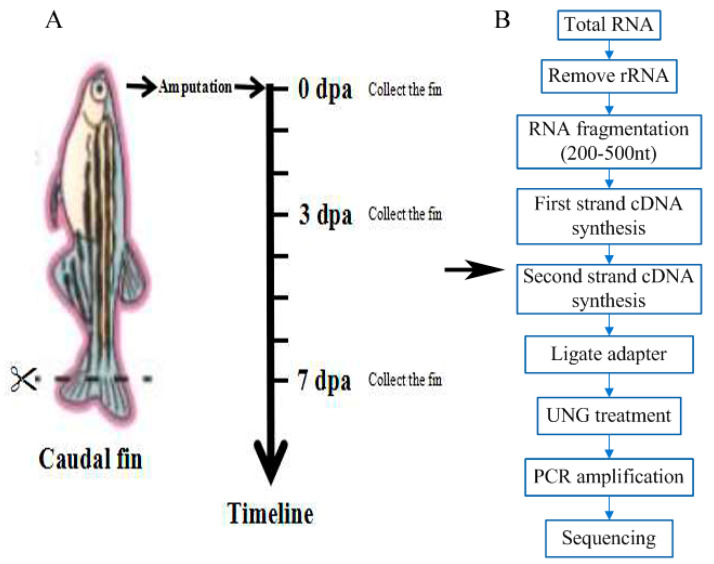
Fig. 1
Schematic diagram of the experimental process. (A) Schematic diagram of the time points of the zebrafish caudal fin sampling. (B) Schematic diagram of the experimental process. CK0dpa, control group at 0 days post-amputation; T3dpa and T7dpa, caudal fin regeneration at 3 and 7 days post-amputation, respectively.
Acknowledgments
This image is the copyrighted work of the attributed author or publisher, and
ZFIN has permission only to display this image to its users.
Additional permissions should be obtained from the applicable author or publisher of the image.
Full text @ Int. J. Mol. Sci.