
|
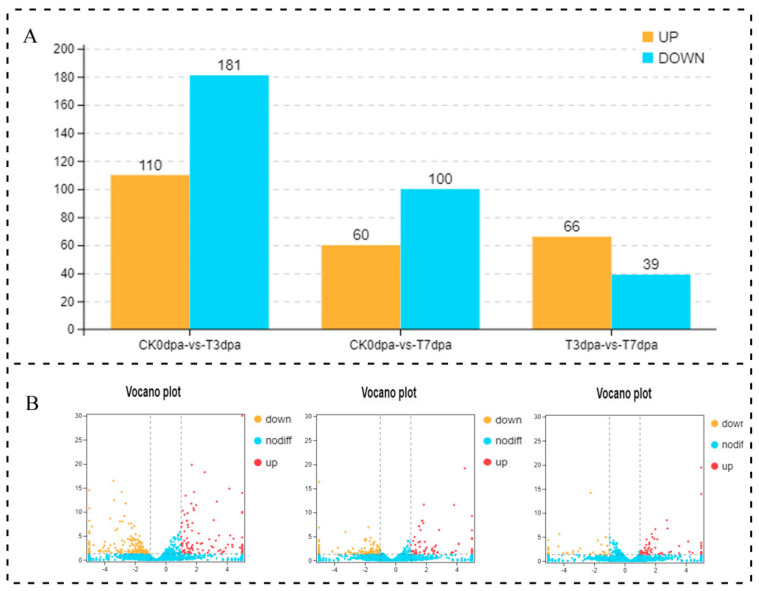
Fig. 3
The statistical analysis on the DE lncRNAs at the different stages of caudal fin regeneration. (A) The numbers of up-regulated and down-regulated lncRNAs at different regeneration stages are showed in a bar graph. (B) The numbers of up-regulated and down-regulated lncRNAs at different regeneration stages are showed in volcano plots. The abscissa represents the logarithmic value of the difference multiple of two samples (CK0dpa vs. T3dpa, CK0dpa vs. T7dpa, T3dpa vs. T7dpa), and the ordinate represents the negative log10 value of the FDR of the two samples. The red (sample−2 expression is up-regulated relative to sample−1) and yellow (the expression level is down-regulated) colors indicate that there is a difference in gene expression (judgment criterion was FDR < 0.05, and the difference multiple was more than 2), and the black color indicates no difference. CK0dpa, control group at 0 days post-amputation; T3dpa and T7dpa, caudal fin regeneration at 3 and 7 days post-amputation, respectively.