
- Title
-
An Association between Insulin Resistance and Neurodegeneration in Zebrafish Larval Model (Danio rerio)
- Authors
- Md Razip, N.N., Mohd Noor, S., Norazit, A., Nordin, N., Sakeh, N.M., Khaza'ai, H.
- Source
- Full text @ Int. J. Mol. Sci.
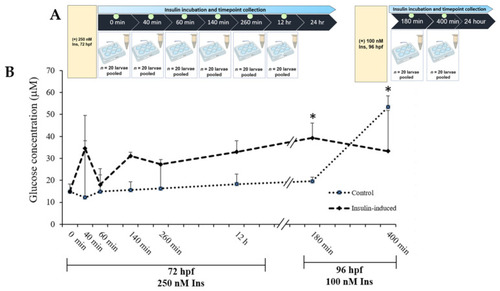
(A) Layout of experimental protocol of insulin inductions in zebrafish larvae. Larvae were induced with 250 nM insulin at 72 hpf followed by sampling after completion of the first insulin induction at 0, 40, 60, 260 and 12 h. The second induction with 100 nM insulin at 96 hpf followed by sampling after the second insulin induction was completed at 180 and 400 min. The control group was immersed in E3 medium. (B) The effects of post-insulin induction on a glucose dynamic study by zebrafish larvae during the first and second insulin inductions. The x-axis values on the scale are in minutes or hours while the y-axis values on the scale are in micromolars. The data are expressed in (mean ± SEM). Statistically significant values are expressed as * p < 0.05. |
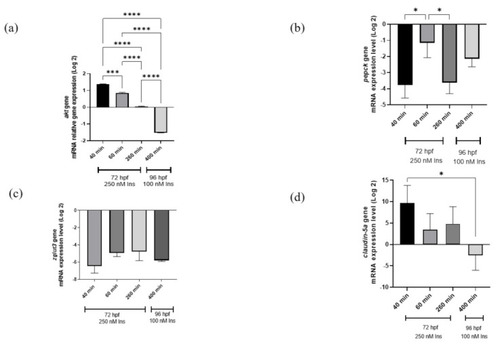
qRT-PCR analysis for insulin resistance model validation with (a) akt, (b) pepck, (c) zglut3, and (d) claudin-5a genes expression on the effects of high insulin induction for 250 nM at 72 hpf and re-challenging after 24 h with 100 nM insulin at 96 hpf. Beta-actin, a housekeeping gene, was used for normalization. Data represent the mean ± SEM; n = 3 independent replicates with 20 larvae in each replicate. Statistical significance, as analyzed by One-way ANOVA with Tukey multiple comparison groups test, is expressed as (*) p < 0.05, (***) p < 0.001 and (****) p < 0.0001. |
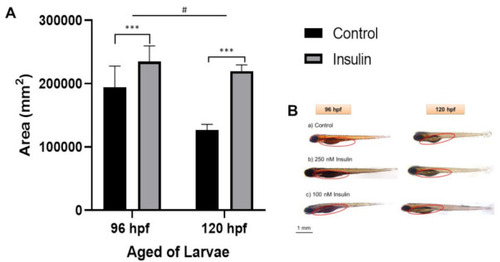
Representative image of whole-mount Oil Red-O (ORO) staining for comparison between control and insulin-induced group larvae (triplicate, pool of three zebrafish per sample). (A) The relative area was counted in six replications using ImageJ software for the total area each of area yolk sac to its yolk extension in each larva (mean ± SEM). Two-way ANOVA was applied for the analysis and p-value is expressed as (***). p < 0.001 is comparing to control and (#) p < 0.05 is comparing to the age factor. (B) The image of ORO staining in 96 and 120 hpf zebrafish in the lateral view is shown with the enlargement in yolk sac size. The circle is a yolk sac area measurement scale at 1 mm. |

Unpaired t-test analysis. Data of (a) MDA and (b) GSH levels are expressed in mean ± SEM with three independent replications for each group pooled with 20 larvae. Statistical analyses are expressed as p < 0.001 (****). |

RNA transcriptomic profiling, based on differential expression genes presented as total genes, were downregulated (219 genes) or upregulated (550 genes) based on the adjusted p-values (p < 0.05). |
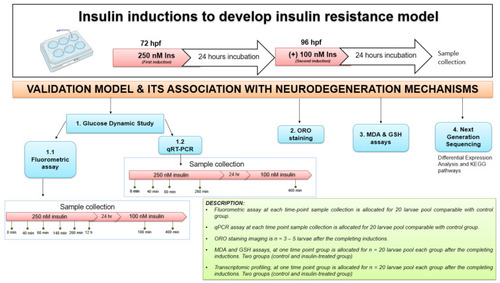
The experimental design for insulin resistance zebrafish larvae model at 72 and 96 hpf with 250 nM and 100 nM insulin induction, respectively, by immersion technique. The groups at each time point were assessed in triplicate (n = 3). The variation in sampling timing after insulin immersion is revealed. Dynamic glucose assay samples for post-insulin immersion were collected at 0 min, 40 min, 60 min, 140 min, 260 min and 12 h at first induction of 250 nM insulin. After the second insulin induction of 100 nM insulin, samples were taken at 180 and 400 min. Quantitative RT-PCR (qRT-PCR) analysis samples were collected at 40, 60 and 260 min of 250 nM insulin induction and at 400 min of 100 nM insulin induction. After each insulin induction, the ORO staining was scored at 96 hpf and 120 hpf after the first and second insulin induction. MDA, GSH and next-generation sequencing (NGS) for transcriptome profiling were developed to connect to the mechanisms of neurodegeneration. The control used was E3 medium containing zebrafish buffer. hour-post-fertilization (hpf); Insulin (Ins). |