
|
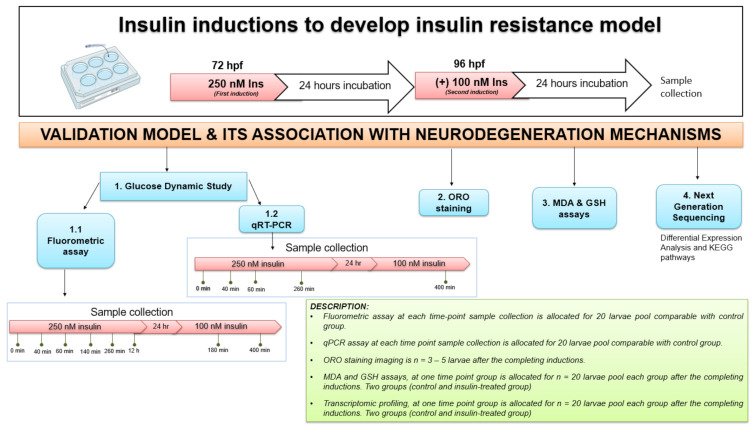
Fig. 6
The experimental design for insulin resistance zebrafish larvae model at 72 and 96 hpf with 250 nM and 100 nM insulin induction, respectively, by immersion technique. The groups at each time point were assessed in triplicate (n = 3). The variation in sampling timing after insulin immersion is revealed. Dynamic glucose assay samples for post-insulin immersion were collected at 0 min, 40 min, 60 min, 140 min, 260 min and 12 h at first induction of 250 nM insulin. After the second insulin induction of 100 nM insulin, samples were taken at 180 and 400 min. Quantitative RT-PCR (qRT-PCR) analysis samples were collected at 40, 60 and 260 min of 250 nM insulin induction and at 400 min of 100 nM insulin induction. After each insulin induction, the ORO staining was scored at 96 hpf and 120 hpf after the first and second insulin induction. MDA, GSH and next-generation sequencing (NGS) for transcriptome profiling were developed to connect to the mechanisms of neurodegeneration. The control used was E3 medium containing zebrafish buffer. hour-post-fertilization (hpf); Insulin (Ins).