
Image
|
Figure Caption
Fig. 5
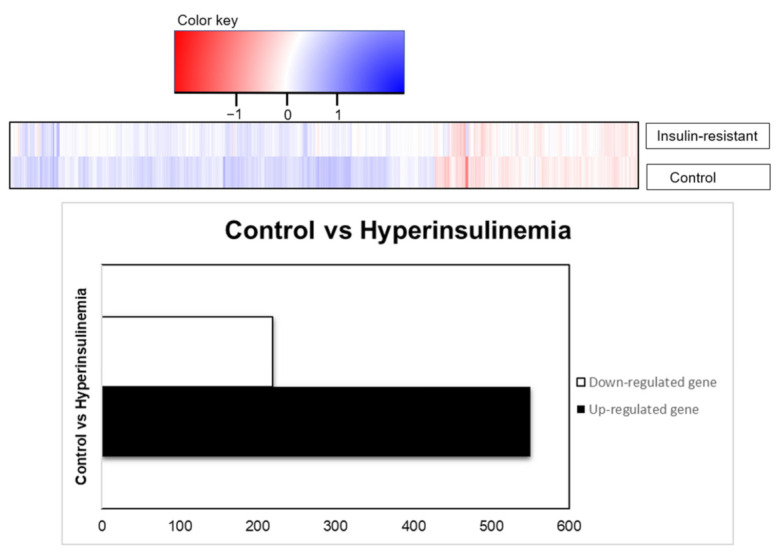
RNA transcriptomic profiling, based on differential expression genes presented as total genes, were downregulated (219 genes) or upregulated (550 genes) based on the adjusted p-values (p < 0.05).
Acknowledgments
This image is the copyrighted work of the attributed author or publisher, and
ZFIN has permission only to display this image to its users.
Additional permissions should be obtained from the applicable author or publisher of the image.
Full text @ Int. J. Mol. Sci.