
|
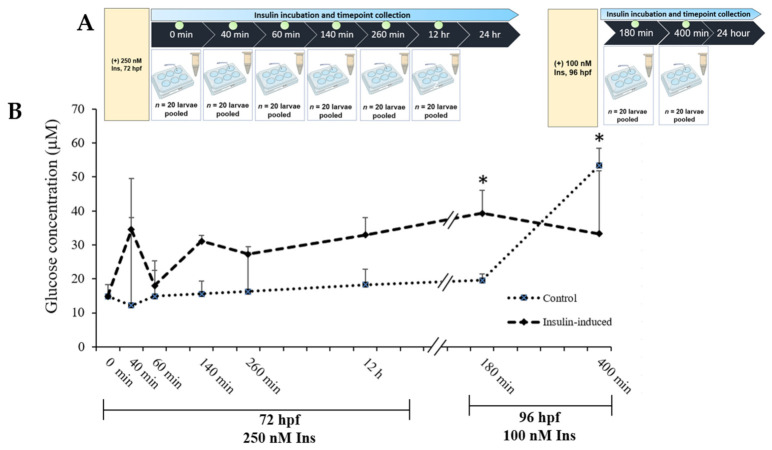
Fig. 1
(A) Layout of experimental protocol of insulin inductions in zebrafish larvae. Larvae were induced with 250 nM insulin at 72 hpf followed by sampling after completion of the first insulin induction at 0, 40, 60, 260 and 12 h. The second induction with 100 nM insulin at 96 hpf followed by sampling after the second insulin induction was completed at 180 and 400 min. The control group was immersed in E3 medium. (B) The effects of post-insulin induction on a glucose dynamic study by zebrafish larvae during the first and second insulin inductions. The x-axis values on the scale are in minutes or hours while the y-axis values on the scale are in micromolars. The data are expressed in (mean ± SEM). Statistically significant values are expressed as * p < 0.05.