
Fig. 3
- ID
- ZDB-FIG-220815-15
- Publication
- Md Razip et al., 2022 - An Association between Insulin Resistance and Neurodegeneration in Zebrafish Larval Model (Danio rerio)
- Other Figures
- All Figure Page
- Back to All Figure Page
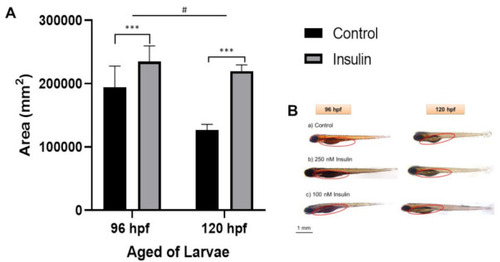
Representative image of whole-mount Oil Red-O (ORO) staining for comparison between control and insulin-induced group larvae (triplicate, pool of three zebrafish per sample). (A) The relative area was counted in six replications using ImageJ software for the total area each of area yolk sac to its yolk extension in each larva (mean ± SEM). Two-way ANOVA was applied for the analysis and p-value is expressed as (***). p < 0.001 is comparing to control and (#) p < 0.05 is comparing to the age factor. (B) The image of ORO staining in 96 and 120 hpf zebrafish in the lateral view is shown with the enlargement in yolk sac size. The circle is a yolk sac area measurement scale at 1 mm. |