
Image
|
Figure Caption
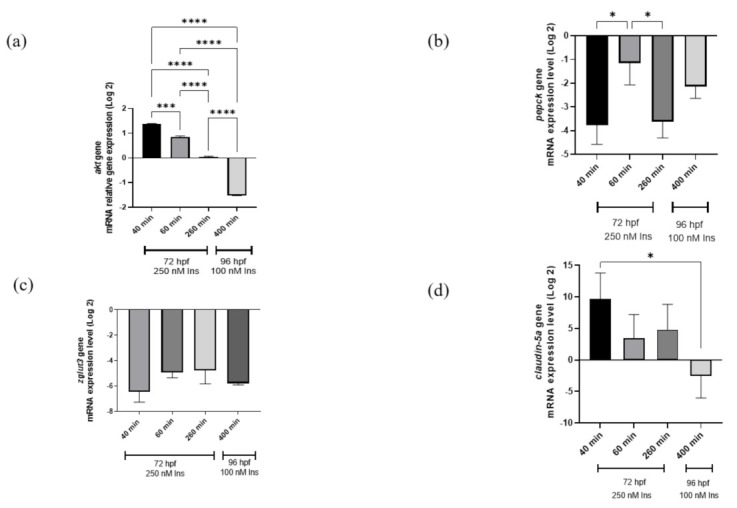
Fig. 2
qRT-PCR analysis for insulin resistance model validation with (a) akt, (b) pepck, (c) zglut3, and (d) claudin-5a genes expression on the effects of high insulin induction for 250 nM at 72 hpf and re-challenging after 24 h with 100 nM insulin at 96 hpf. Beta-actin, a housekeeping gene, was used for normalization. Data represent the mean ± SEM; n = 3 independent replicates with 20 larvae in each replicate. Statistical significance, as analyzed by One-way ANOVA with Tukey multiple comparison groups test, is expressed as (*) p < 0.05, (***) p < 0.001 and (****) p < 0.0001.
Acknowledgments
This image is the copyrighted work of the attributed author or publisher, and
ZFIN has permission only to display this image to its users.
Additional permissions should be obtained from the applicable author or publisher of the image.
Full text @ Int. J. Mol. Sci.